Share the impact report with leadership
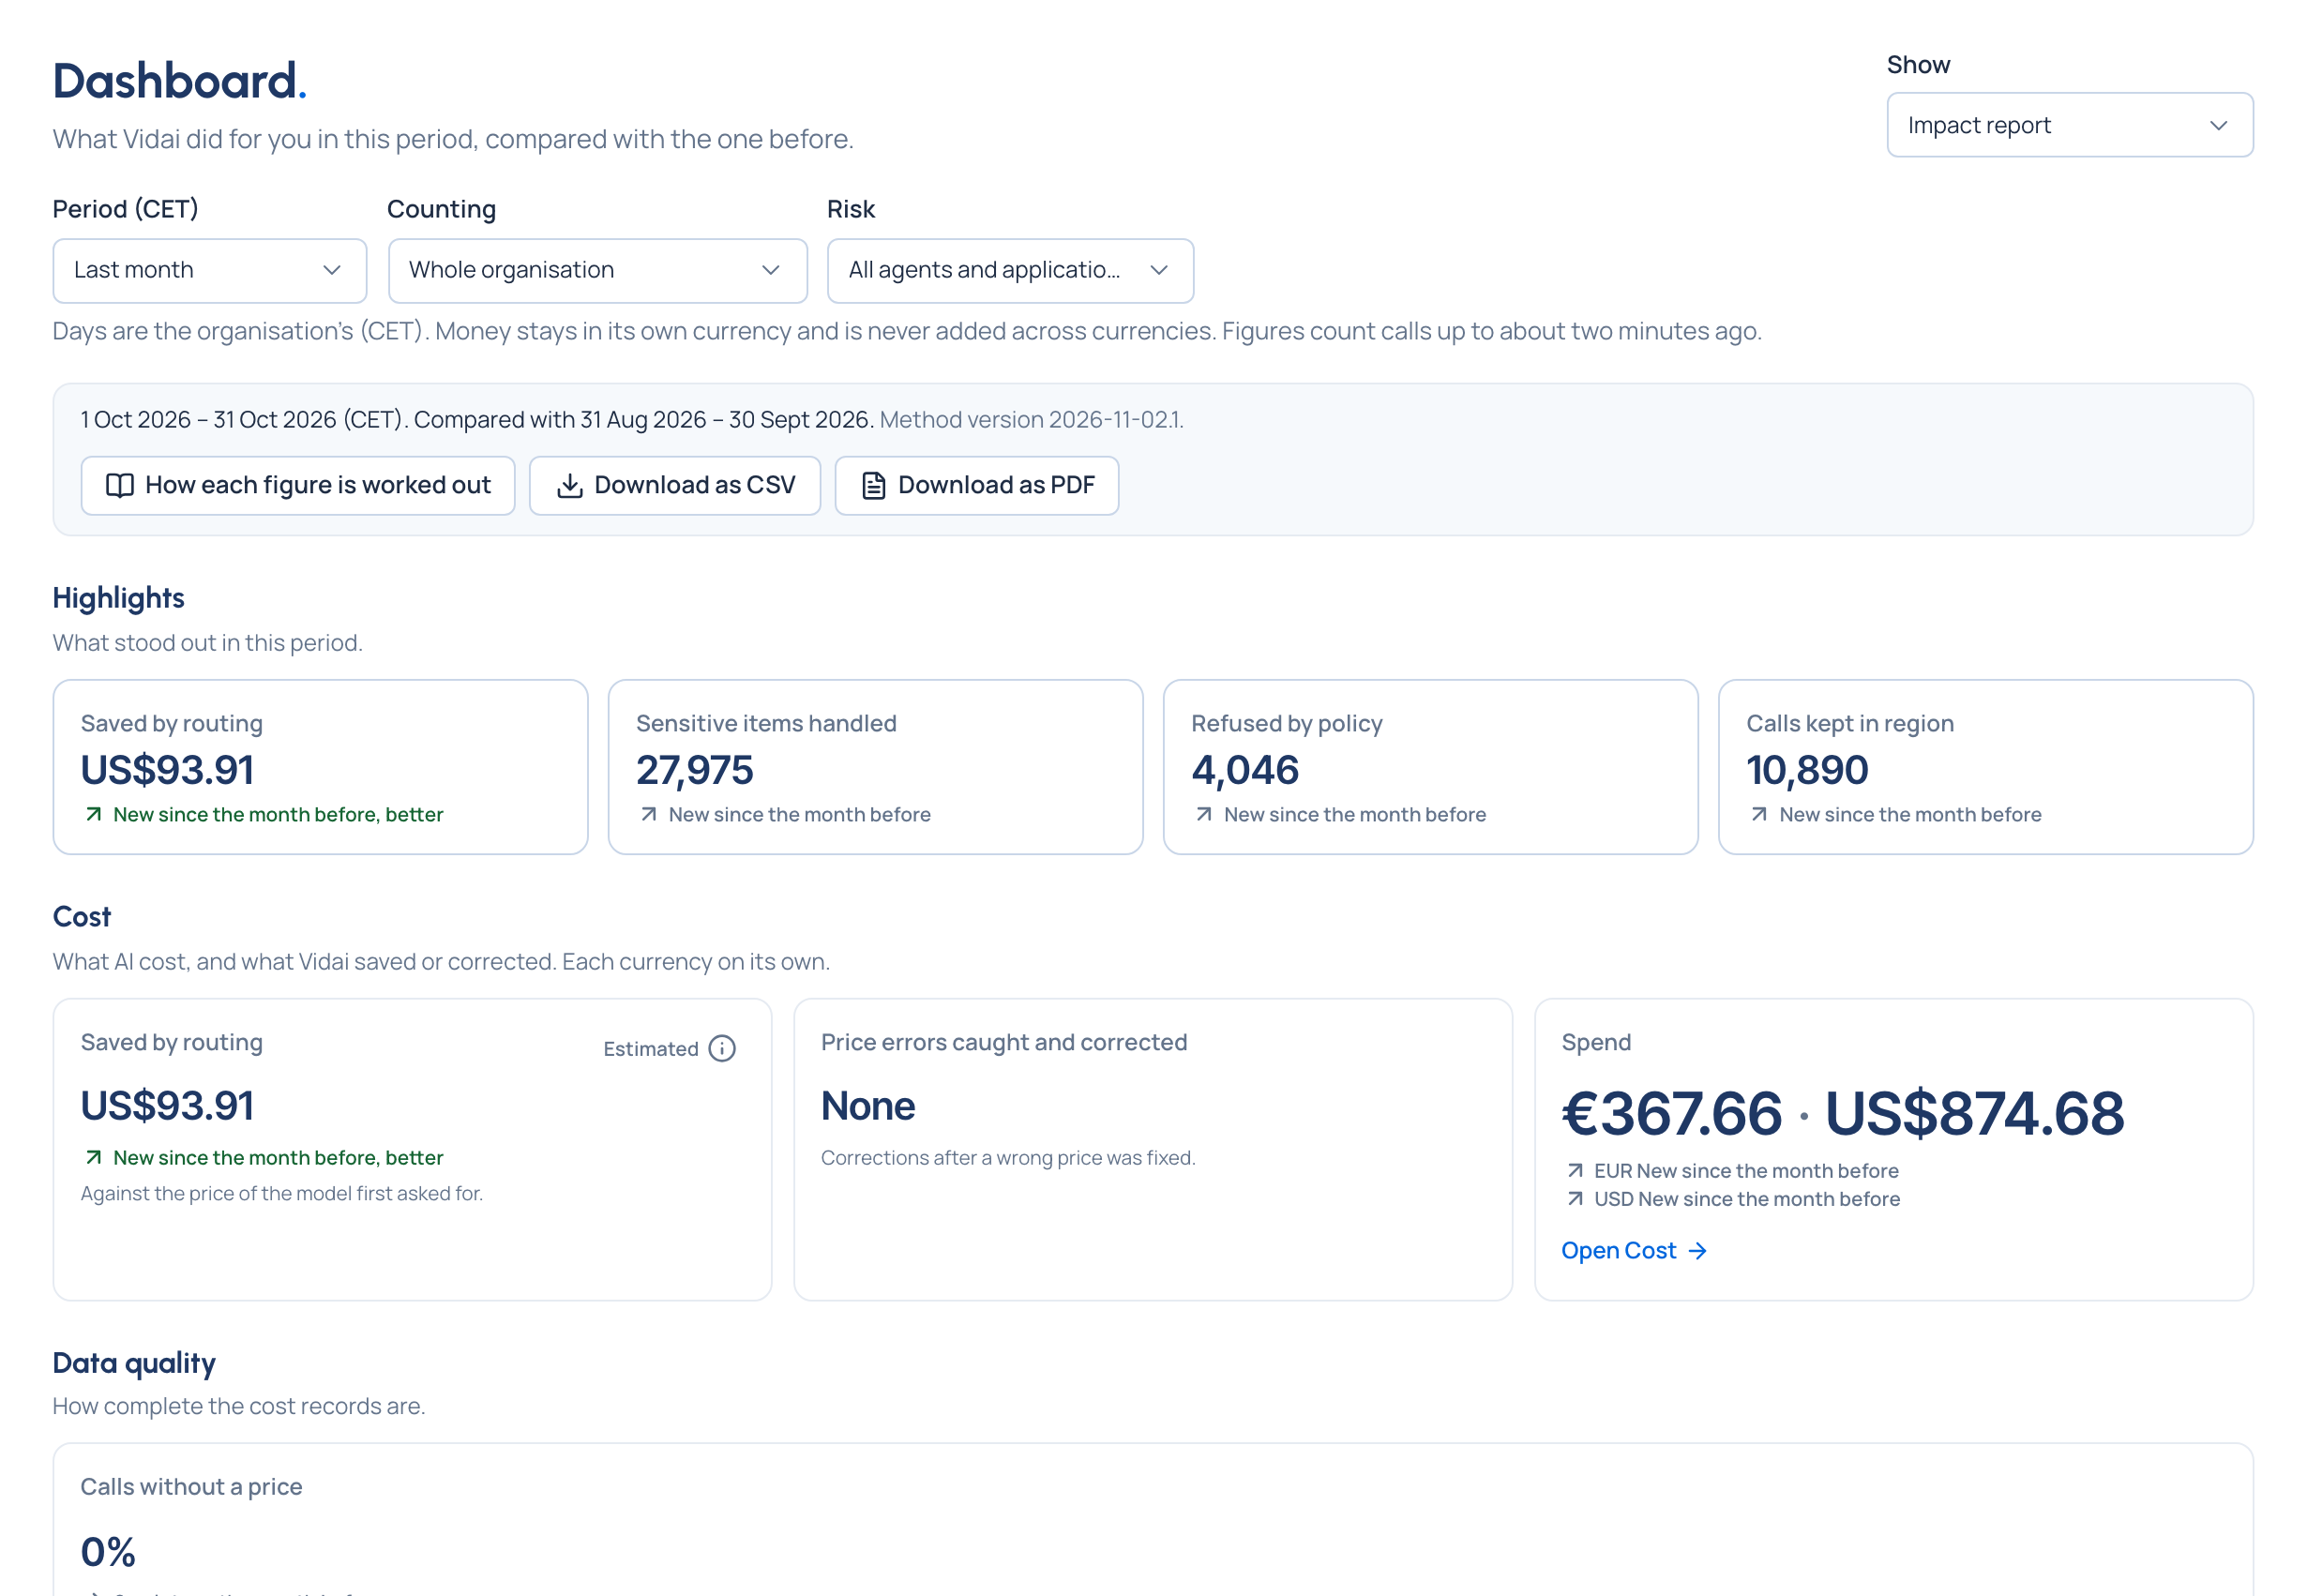
Purpose: give leadership the outcomes, not the settings: what was spent and saved, what data was protected, what was refused, how many calls were rescued and how far governance reaches, against the period before. It shows no policies, settings or vendors, so it can be forwarded.
Before you start
Organisation admins, organisation viewers, group admins (their teams), Finance and Compliance officers Enterprise can open it.
Steps
- Open Dashboard and choose Impact report in Show (or Open the impact report on Home).
- Choose the Period and what you're Counting. The report compares it with the period before, and says which.
- Read Highlights first: up to four outcomes worth saying, in Vidai's order.
- Read each area:
- Cost: spend, saved by routing, price errors corrected;
- Data quality: the unpriced share;
- Data protection: sensitive items handled, by kind and action; calls not checked and why;
- Compliance: refused by policy, kept in region, the share of calls checked;
- Resilience: calls rescued, outages absorbed;
- Adoption: active people, agents and applications;
- Reach: what's under governance.
- Read Over the period: a small chart each for spend (per currency), calls, guardrail actions, refusals and calls rescued, each with Show as table.
- To share it:
- Download as CSV saves a row per figure with its area, the period before and the change.
- Download as PDF prepares the report, opens it laid out for paper and opens your browser's print dialog: choose Save as PDF. Print or save as PDF opens the dialog again.
Check it worked
The PDF's footer gives the organisation, the period and the one compared with, the time zone, the method version, who generated it and when, and the export id with the file's SHA-256, so anyone can check a copy against the file Vidai keeps for a week.
Reading the changes
Each figure's change says the direction in an arrow and words, and better or worse (in colour too) only where one way is good news. Money changes are per currency. How each figure is worked out opens each figure's definition, with the method version.
Good to know
- The report is a record of outcomes, not a statement of compliance.
- The PDF is made by your browser from the report Vidai prepares; how it looks on paper depends a little on the browser.
Related
- Read Home at a glance: this month's headline figures on Home.
- Read your dashboard