Read your dashboard
Purpose: get the picture for exactly the period, part of the organisation and risk level you're asked about, and know what each figure does and doesn't count.
Before you start
You have a Dashboard if you're an organisation admin, organisation viewer, group admin, Finance or a Compliance officer Enterprise. Who sees what
Steps
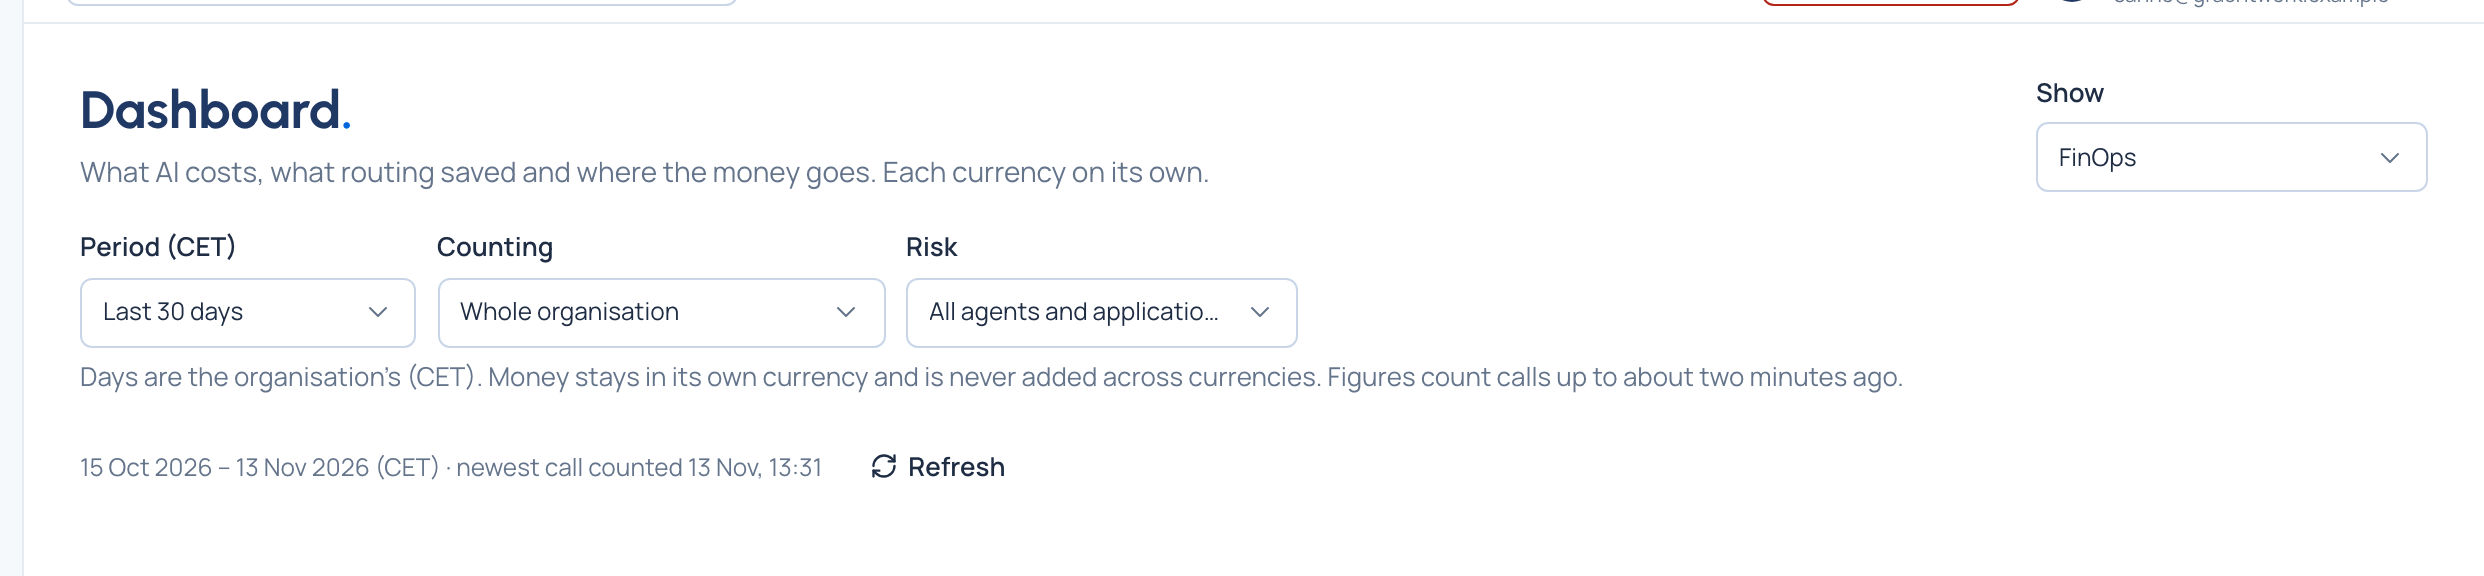
- Open Dashboard. With more than one view, choose it in Show (Admin, FinOps, Compliance, Impact report). With one, the page is titled with that view.
- In the filter row, choose the Period: today, yesterday, this or last week, month or quarter, the last 30 or 90 days, the year to date, or Choose dates (From and To). Days are the organisation's, as the label says, for example "Period (CET)".
- Choose what to count in Counting: Whole organisation, a team (and the teams under it), an application or an environment. A group admin sees All your teams and only their teams in the list.
- Choose a Risk level, or All agents and applications: with a level chosen, only calls by agents and applications at that level are counted. People's own keys carry no risk level, so their calls aren't counted then.
- Read the line under the filters: the days counted, and when the newest counted call was made. Refresh reads every figure again without reloading.
- To share the exact picture, copy the address: the view, period, scope and risk level are in it.
Reading the figures
- Money is always in its own currency, side by side ("€410.27 · US$1,530.00"), never added or converted. Charts of money are one per currency.
- The change under a figure compares it with the same number of days just before ("+12% vs the 30 days before"). An arrow and words say the direction; it's green only where up is good (savings, calls rescued) and red where up is bad (failures, calls not checked). No change is shown for money in more than one currency, or for counts that are as of now.
- Estimated marks a figure worked out rather than counted (what routing saved; the response time). The ⓘ beside it says how.
- Not available means Vidai can't give that figure, and says why: it comes with Enterprise, it isn't recorded yet for that period, or there were no calls to measure. Never shown as zero.
- No calls in this period yet replaces a row of zeros, with Show the last day with calls when there were calls before.
- Charts show the five biggest teams, models or states and Other for the rest. Each has Show as table. Hover or tab onto a chart to read a day's values. A colour stays with its team or state whatever the period.
- Links under a figure open the list behind it with the same period and filters (Calls, Cost, Budgets, Routing, Guardrails, Compliance, Home). Organisation viewers don't get them.
- Counted for the whole organisation: on a board narrowed to a team, application, environment or a group admin's teams, open overrides and exemptions and content reads aren't split by team. They say so, with a link to the organisation's board.
Check it worked
The line under the filters names your period and scope ("Your teams" for a group admin).
Good to know
- Figures count calls up to about two minutes ago.
- Choosing an application or an environment in Counting doesn't narrow the Compliance view's coverage grid or heatmap; a team does.
- Applications and environments in Counting are offered to organisation readers only.
Related
- Admin · FinOps · Compliance · Impact report