Dashboards and the impact report
An admin wants to know what's failing, Finance where the money goes, a compliance officer whether calls were actually checked, and leadership what all of it achieved. Usually each of those is a report someone builds by hand. Vidai counts every call through the gateway, so each role gets its own Dashboard, scoped to what it may see, and the impact report sums up the period's outcomes in a form you can forward.
The views
| View | For | What it answers |
|---|---|---|
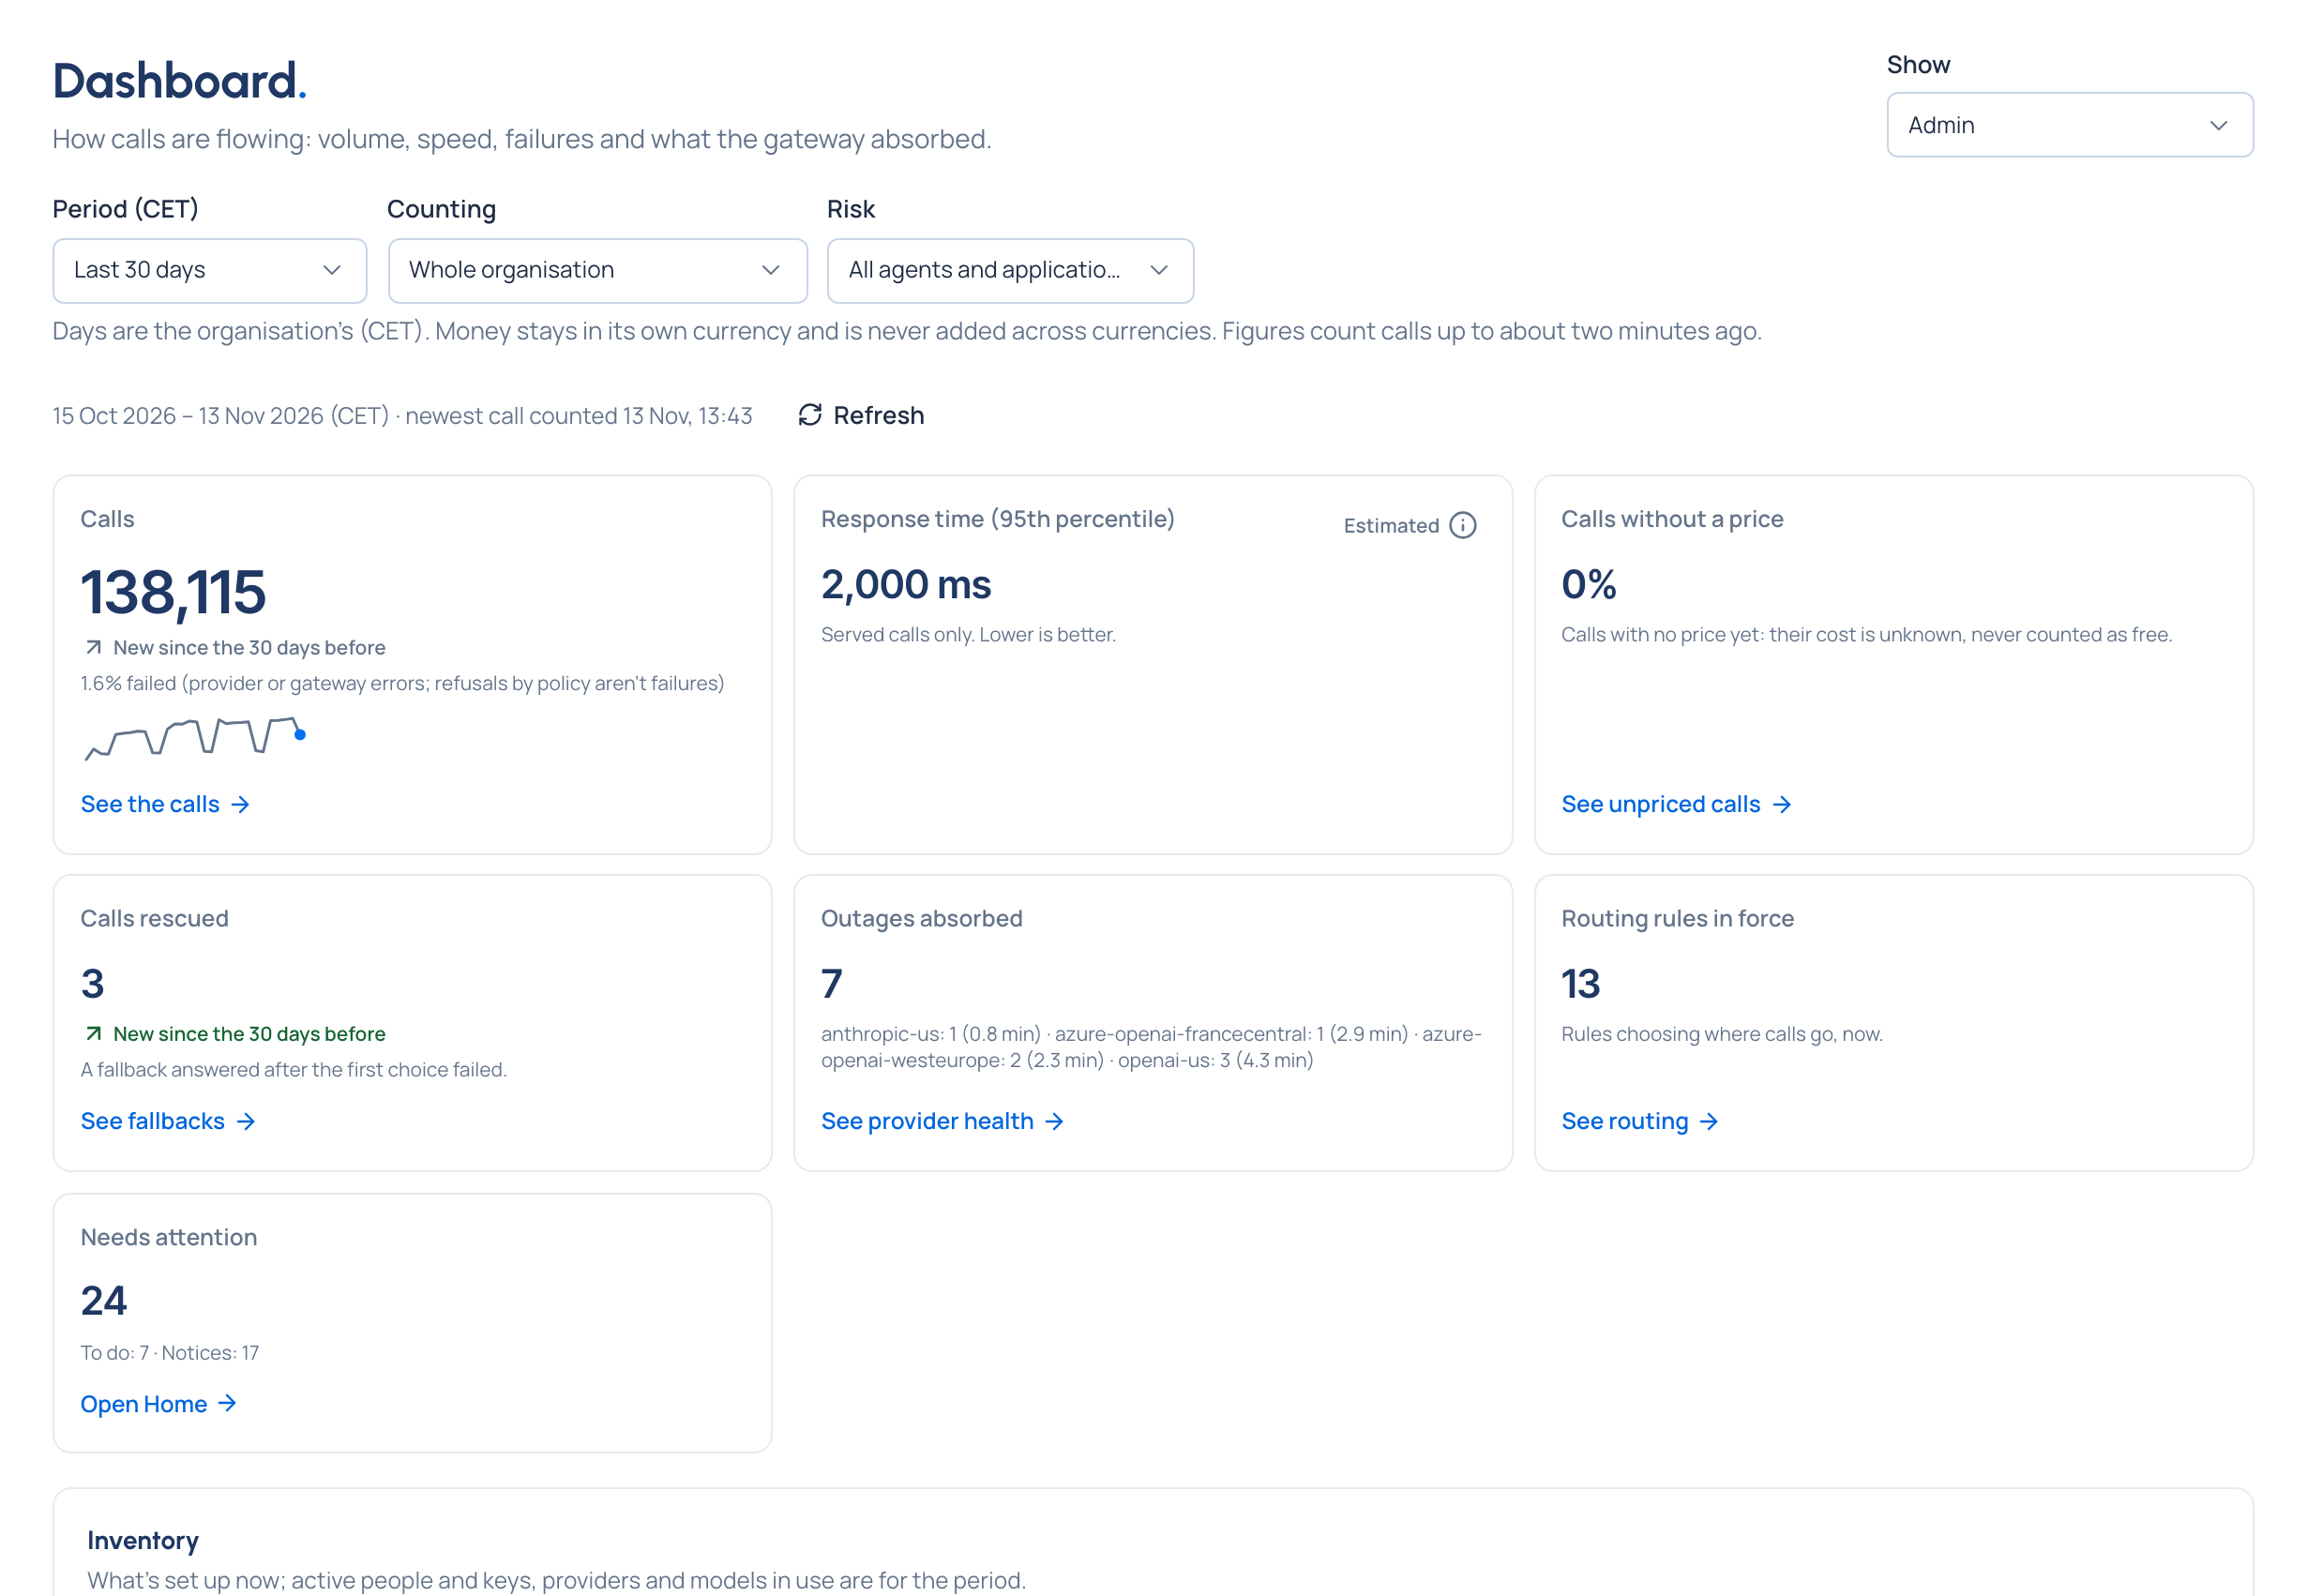
| Admin | Organisation admins, viewers, group admins | Calls and the share that failed, response time, calls rescued by a fallback, provider outages absorbed, what needs attention, the busiest models, tokens by model, the inventory |
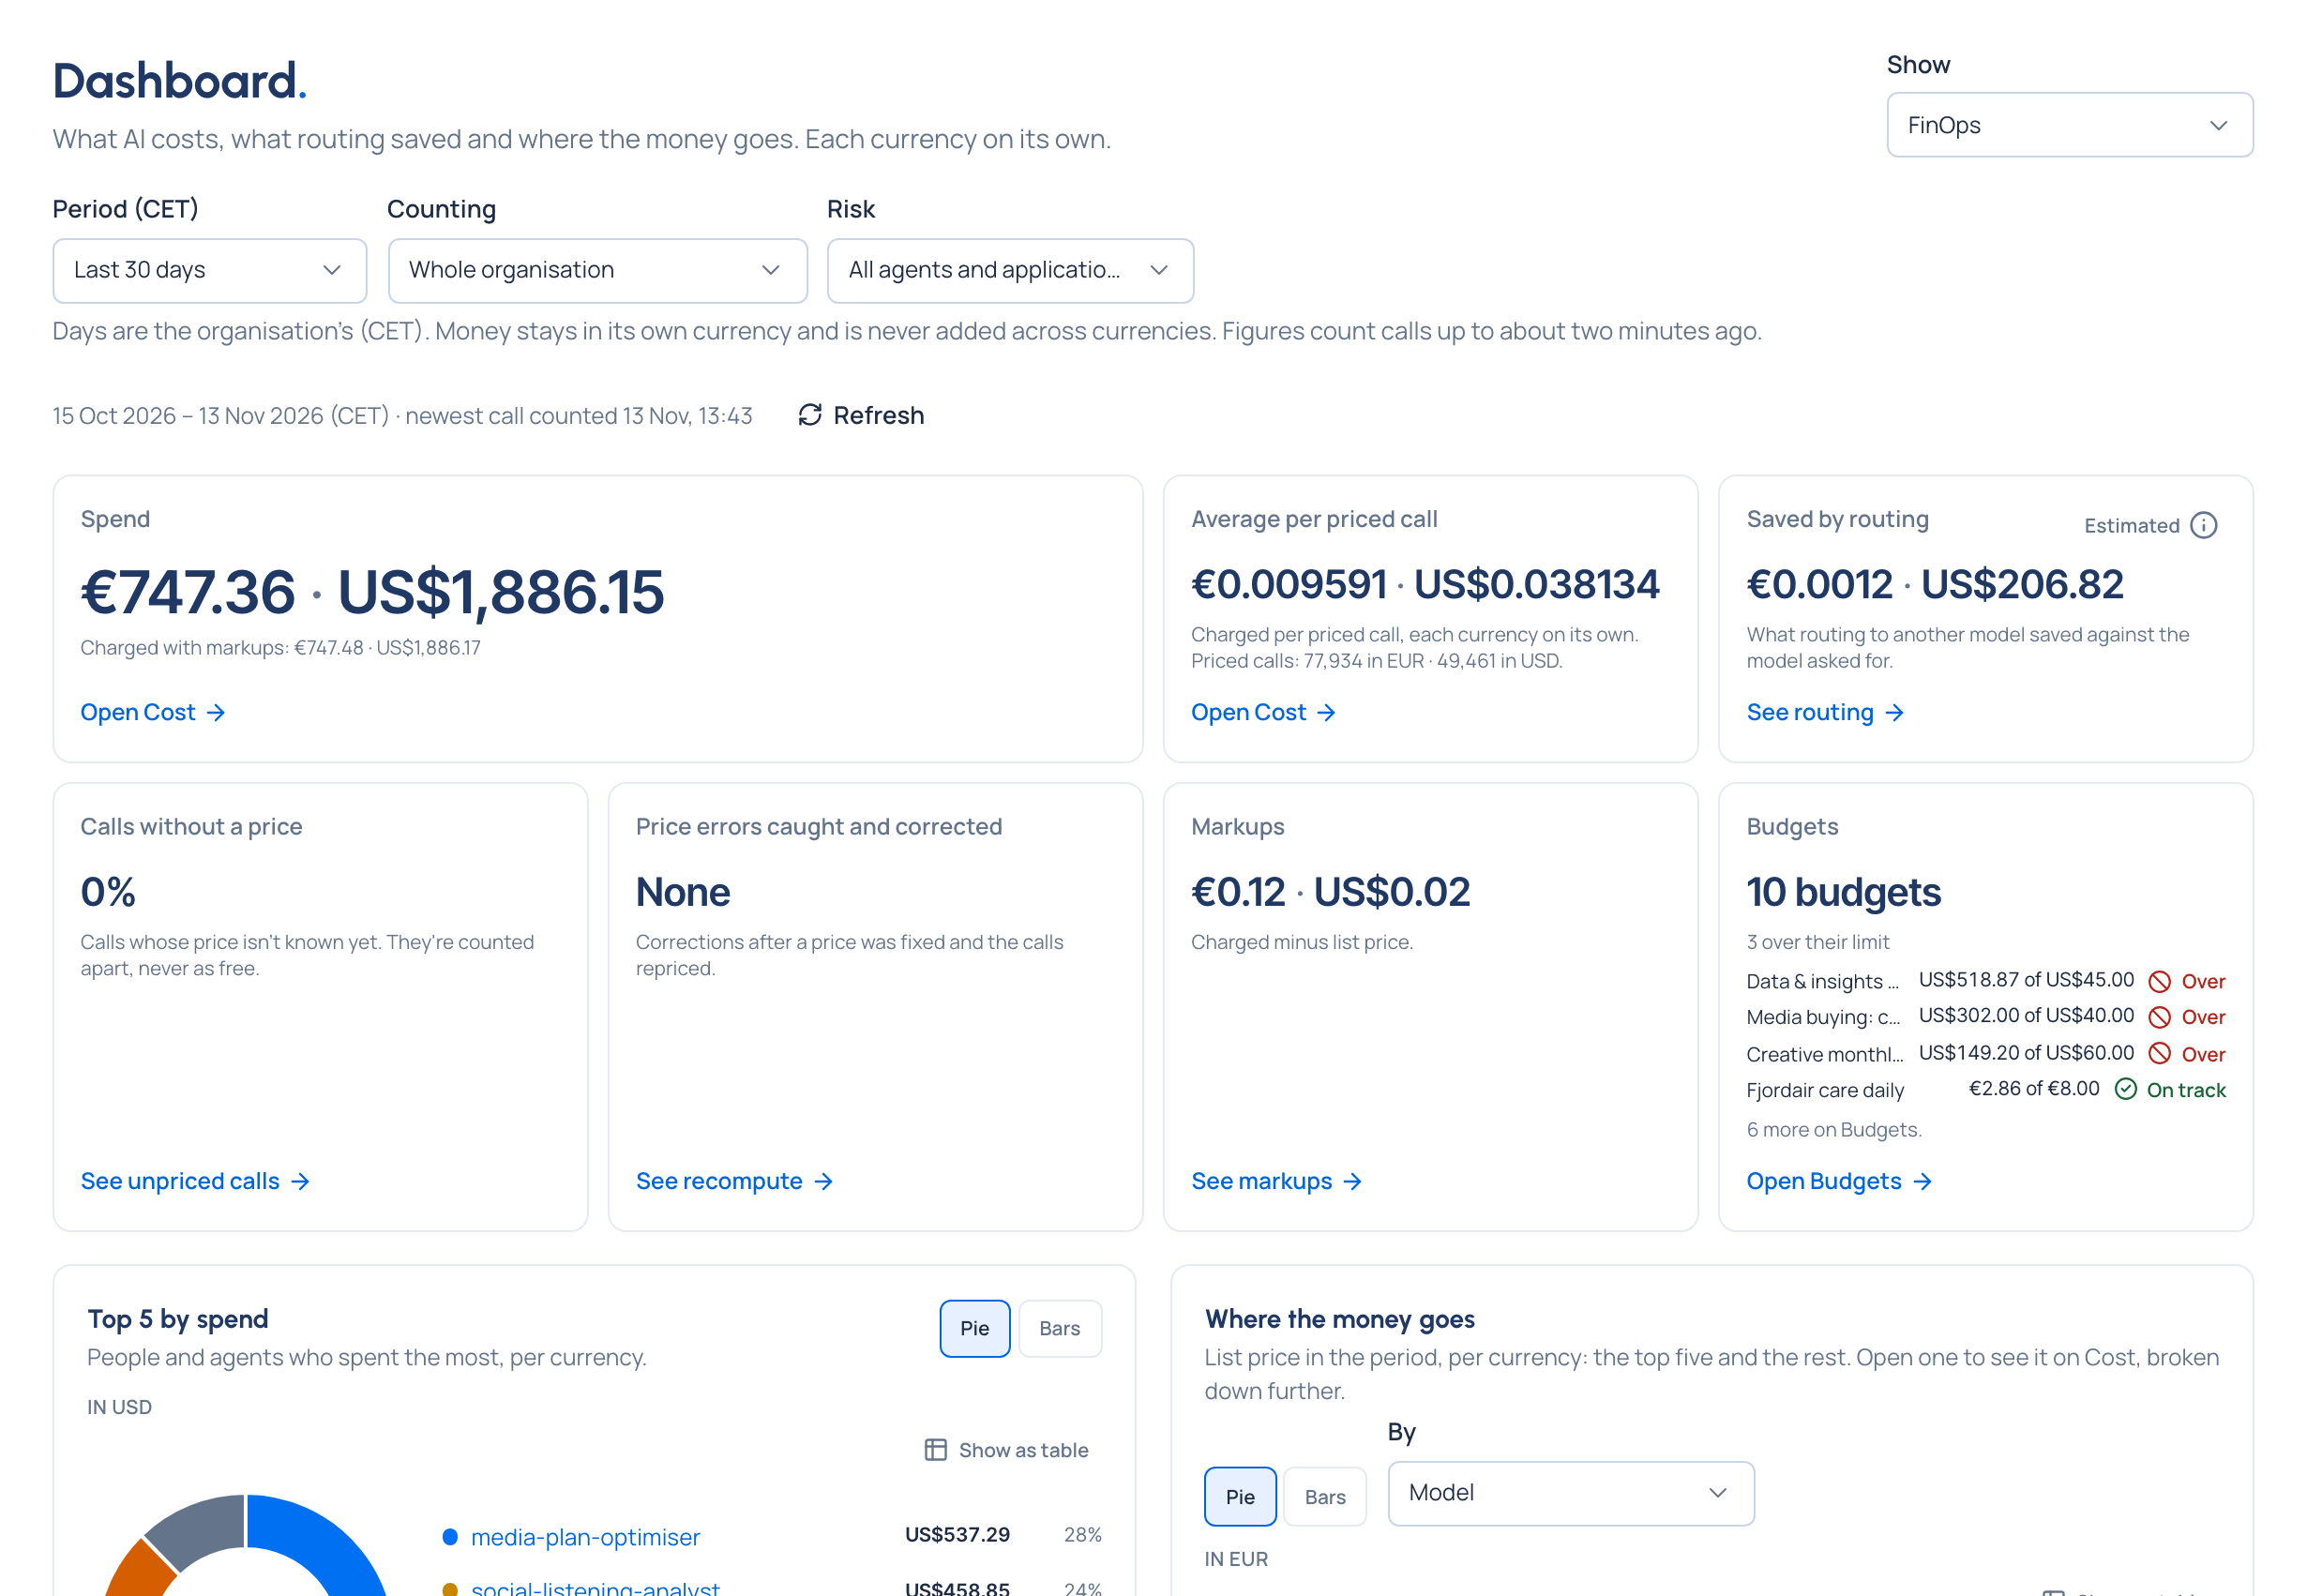
| FinOps | Organisation admins, group admins, Finance | Spend at list price and charged, average per priced call, saved by routing, unpriced share, top spenders, where the money goes, budgets in force |
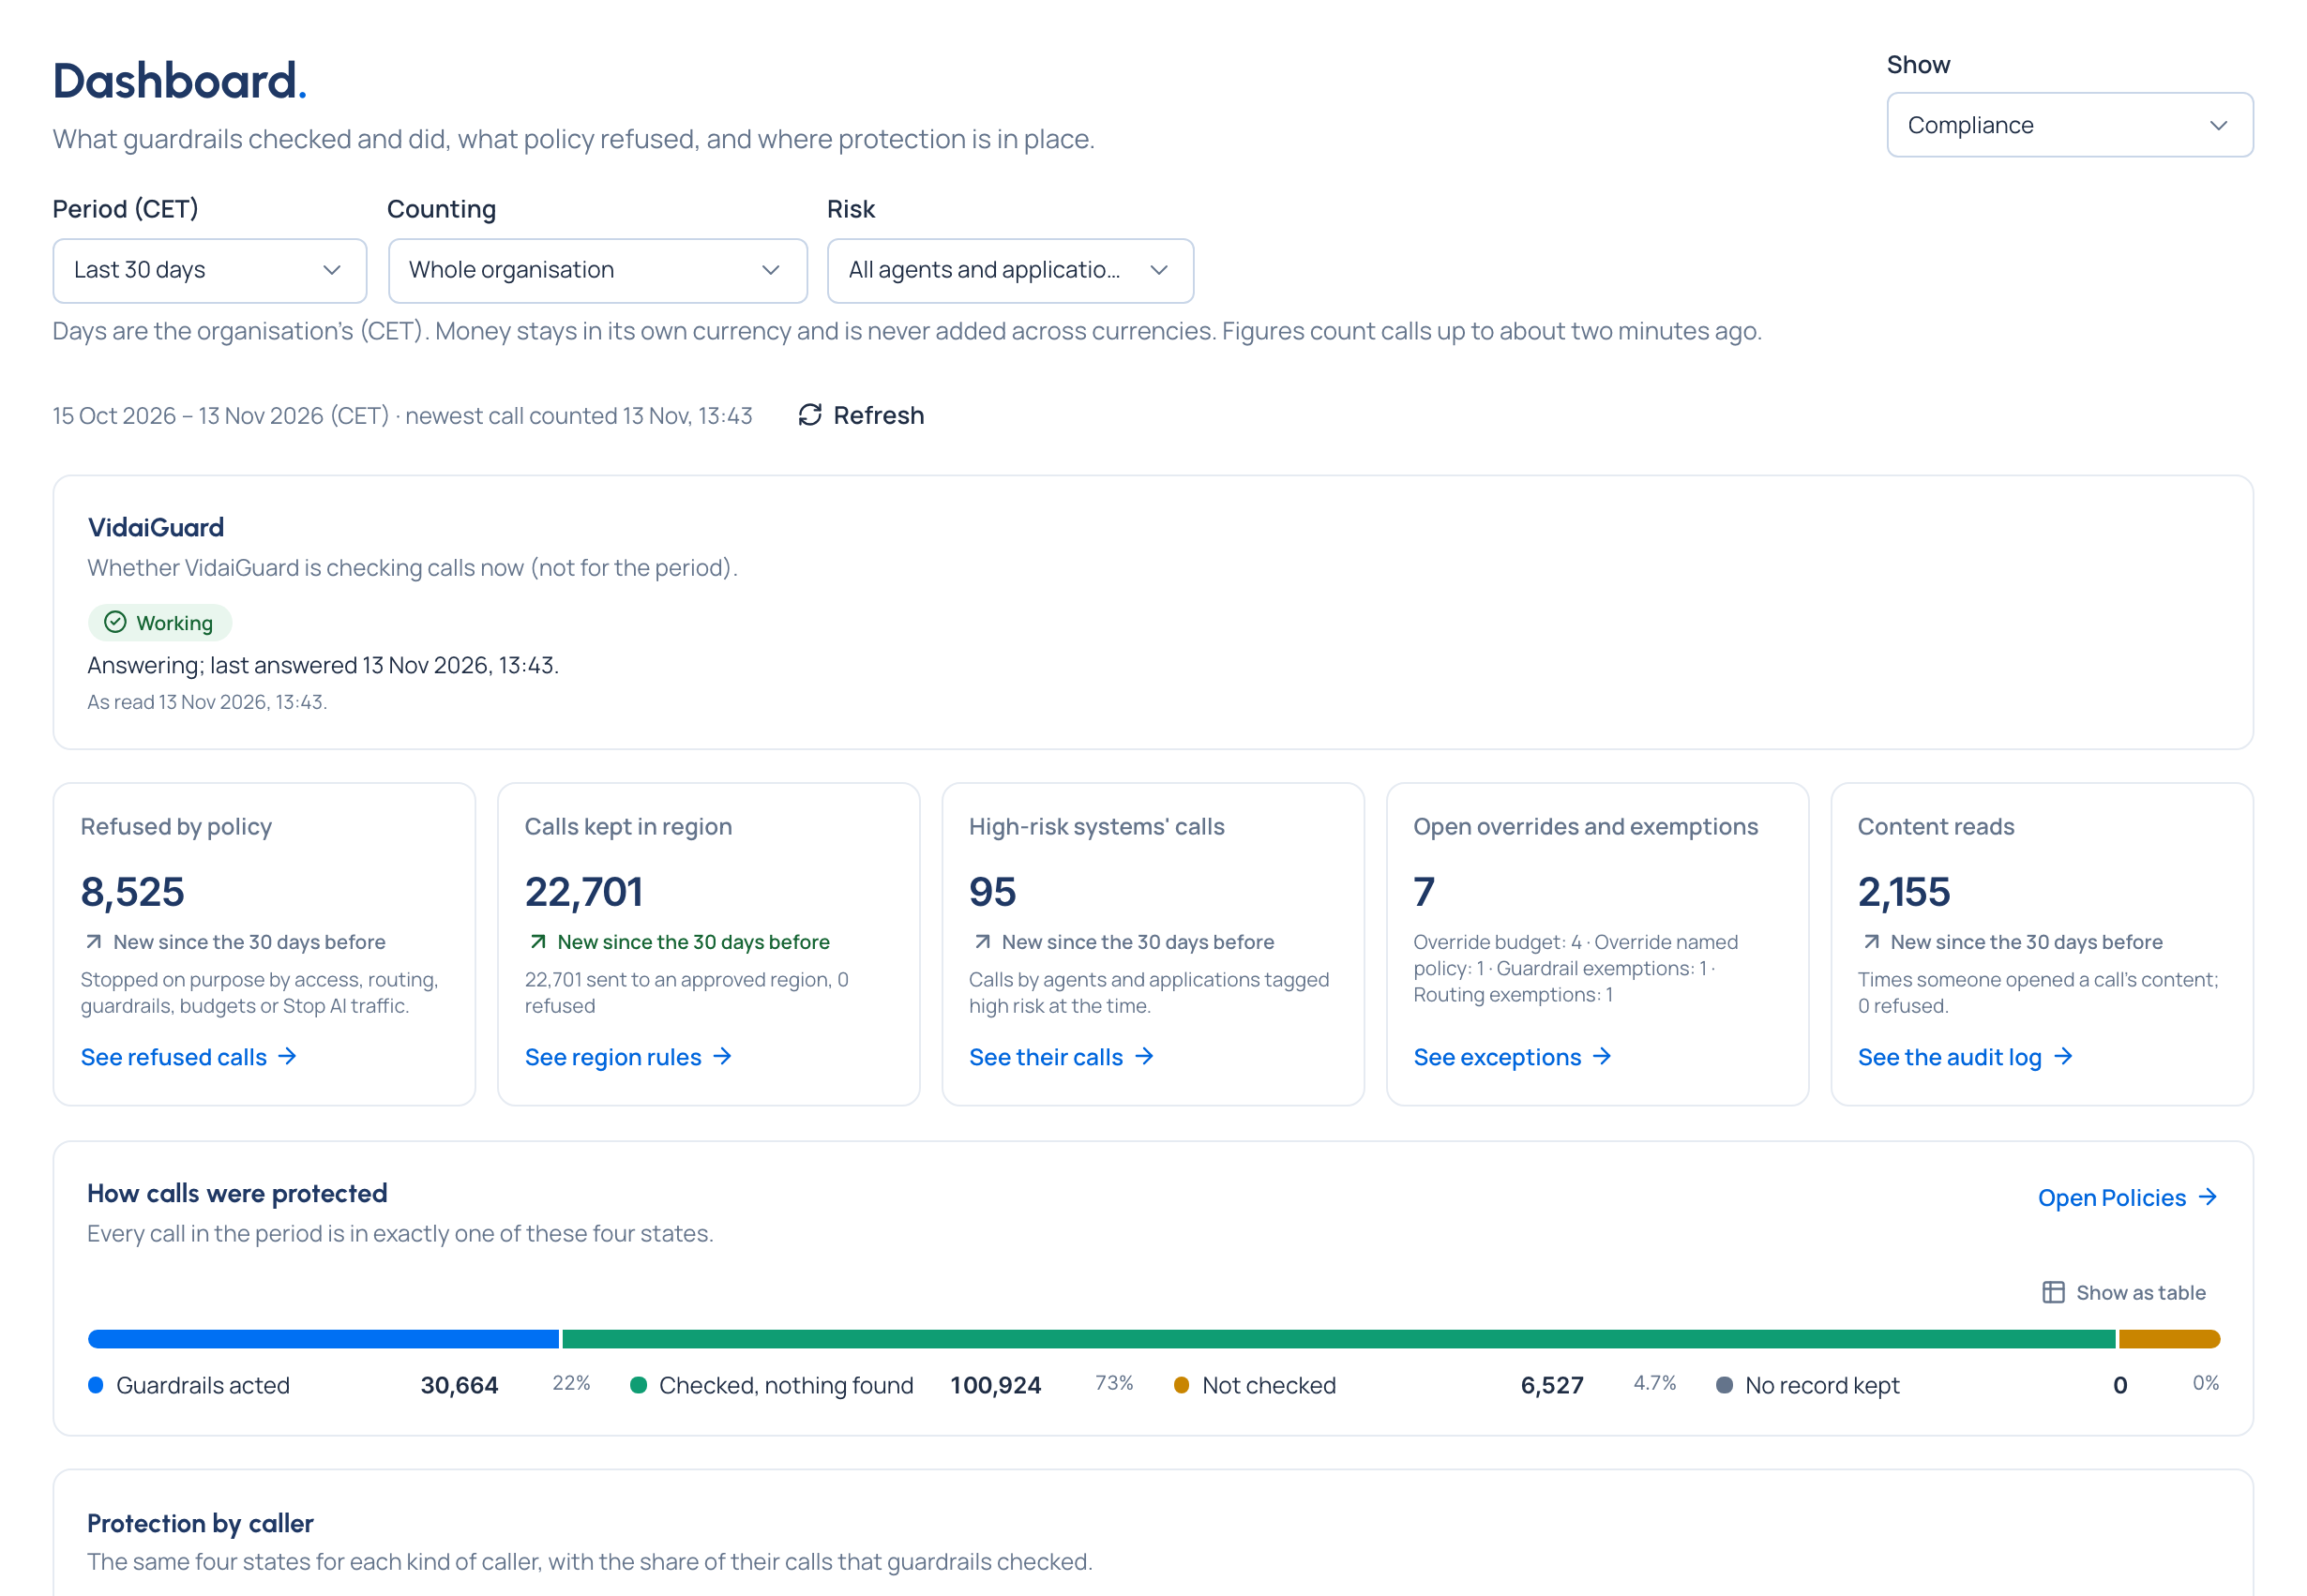
| Compliance Enterprise | Organisation admins, group admins, Compliance officers | How calls were protected, protection by caller, calls refused by policy and kept in region, high-risk systems, where protection is in place, where findings come from |
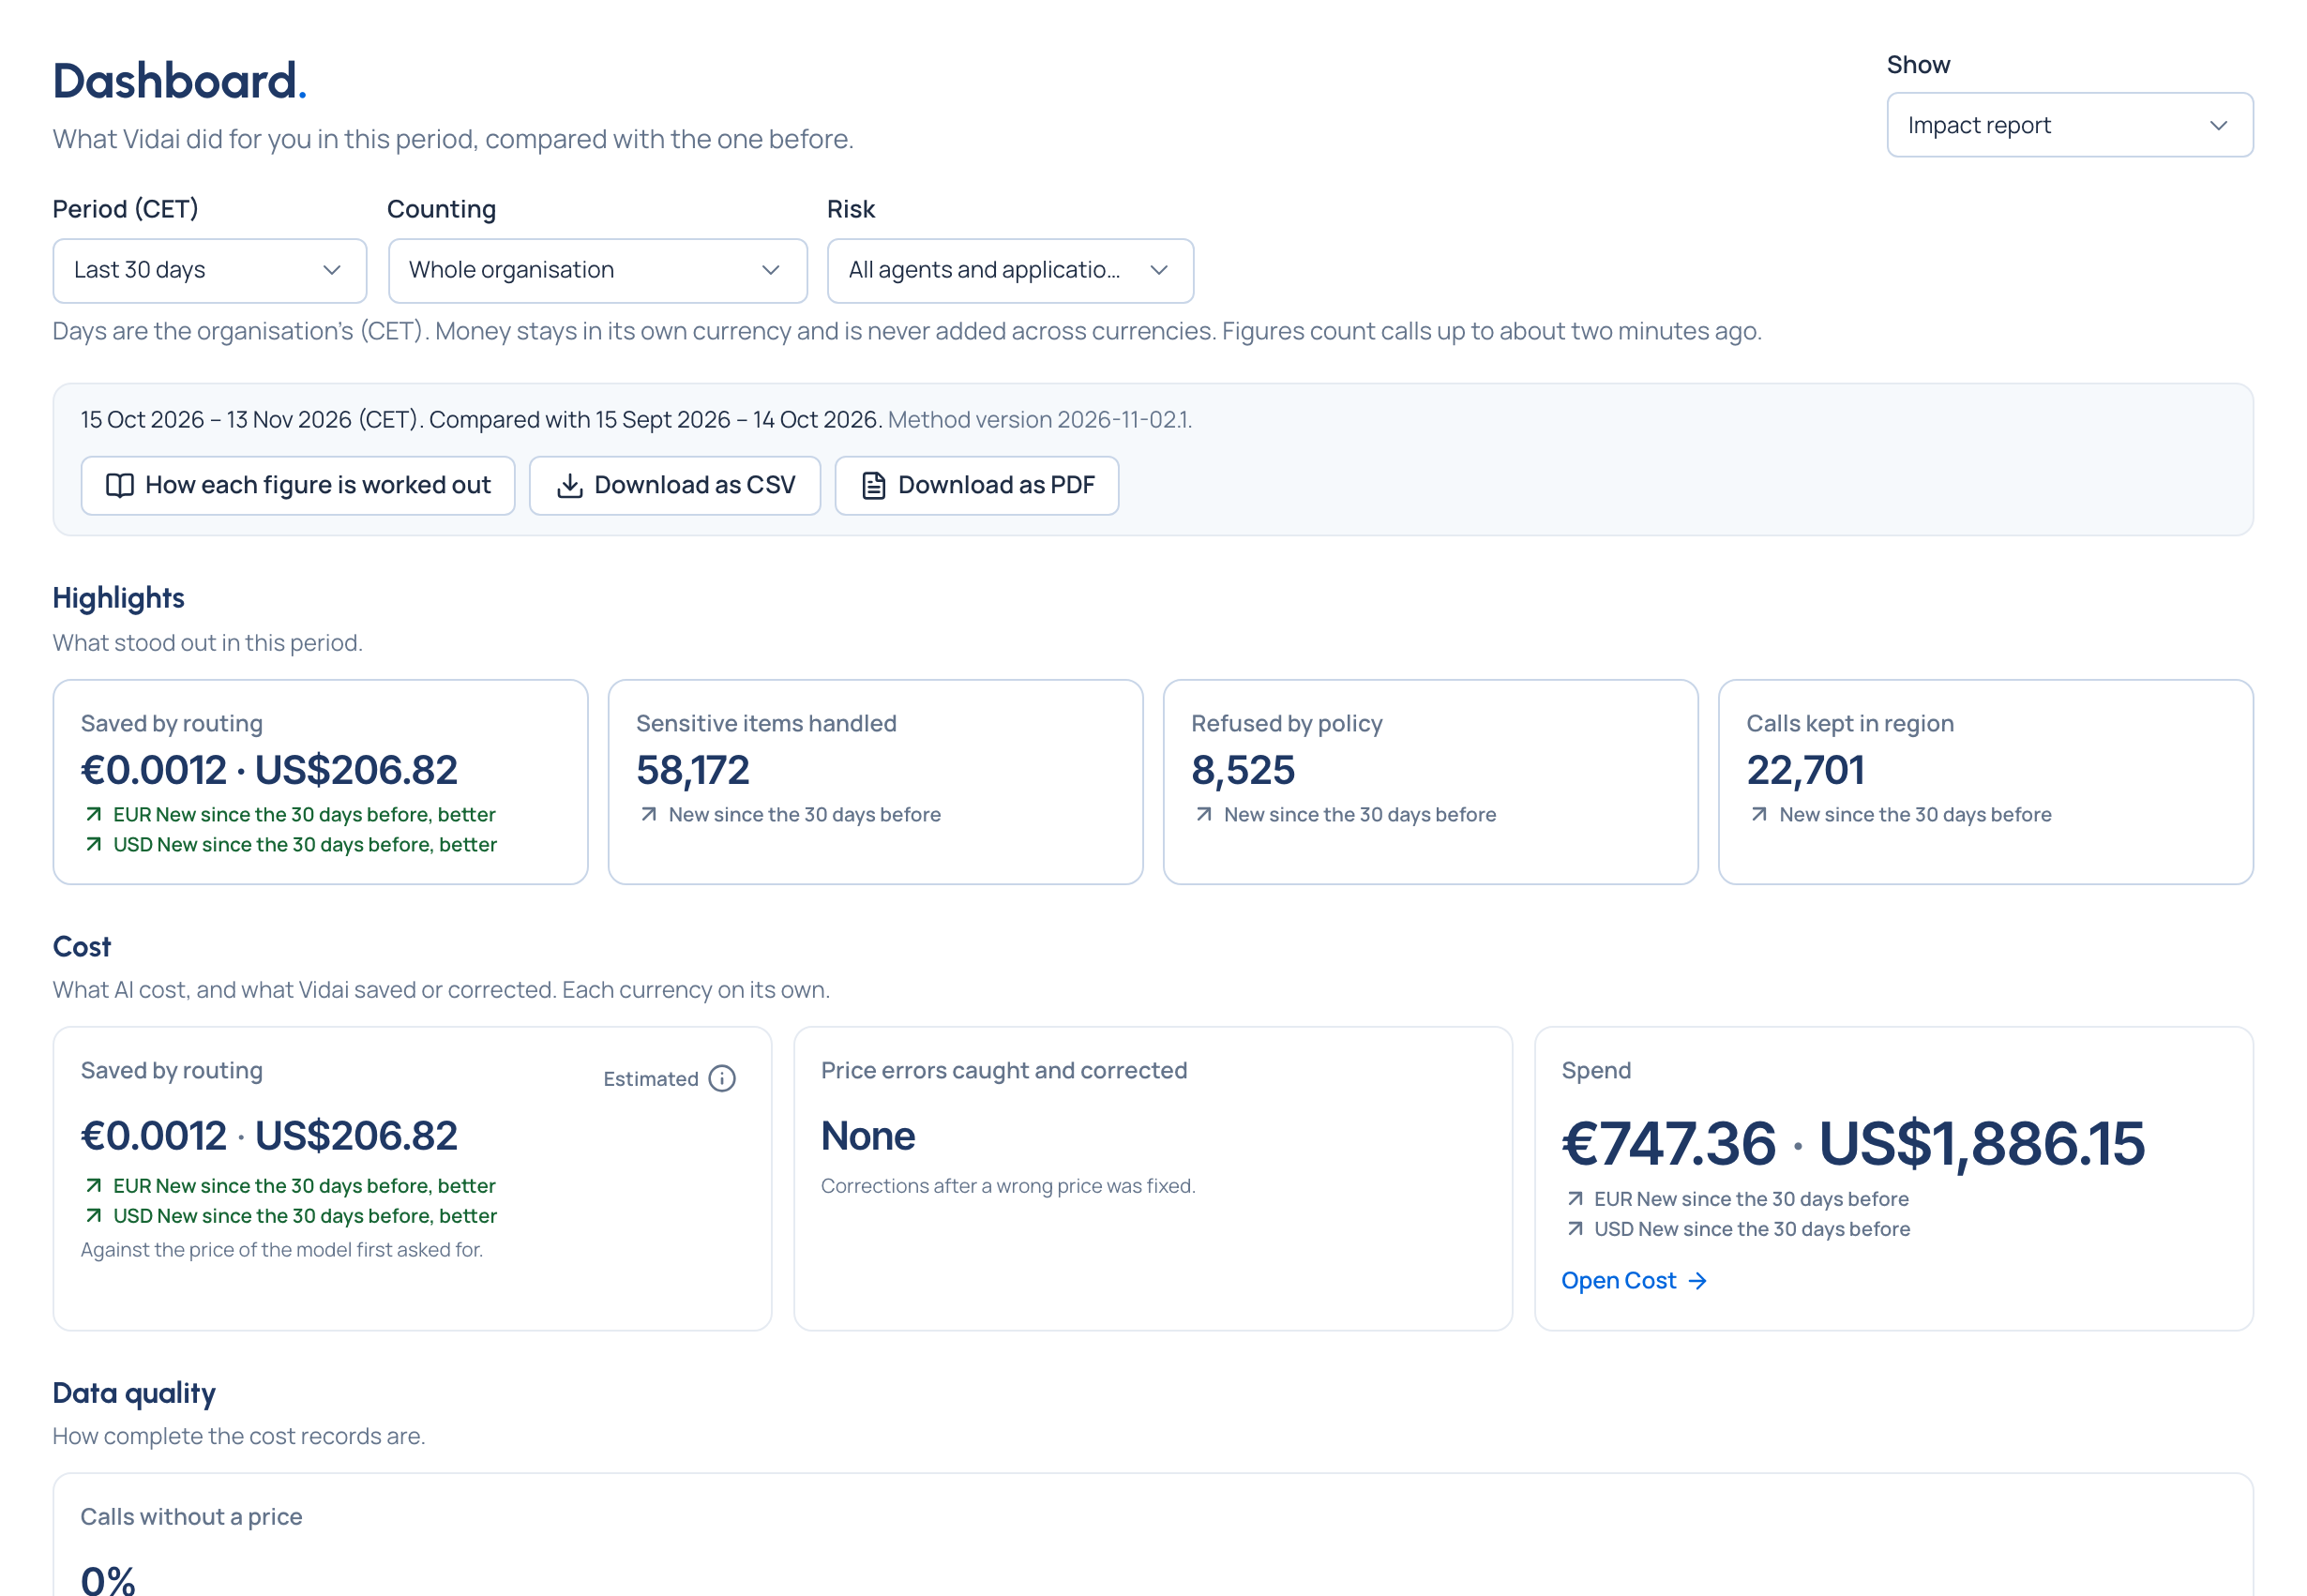
| Impact report | Organisation admins, viewers, group admins, Finance, Compliance officers | What Vidai did in the period, against the period before |
What Enterprise includes depends on the features your licence includes. On Community, the Admin and FinOps views and the impact report are all there. A group admin's board counts their own teams only. Everyone else has their usage on Home.
What's counted, and how honestly
- One row of filters scopes the board: the Period (in the organisation's days), what's Counting (the whole organisation, a team and those under it, an application or an environment) and the Risk level of the agents and applications that made the calls.
- Money stays in its own currency, side by side; charts of money are one per currency.
- Not available says why a figure can't be given; it's never shown as zero. Estimated marks a figure worked out rather than counted, with how.
- Every call is in exactly one protection state on the Compliance view: guardrails acted, checked and nothing found, not checked, or no record kept. Together they add up to all calls, so a gap can't hide.
- Findings per 1,000 calls, so a big team doesn't look riskier just for being big.
- Every figure links to the list behind it (Calls, Cost, Budgets, Routing, Guardrails), with the same period and filters; organisation viewers see the figures without the links.
The impact report
What Vidai did in the period, against the one before, in outcomes only: never your policies, settings or vendors, so it can be forwarded. Highlights first, then Cost, Data quality, Data protection, Compliance, Resilience, Adoption and Reach, each figure with its change and, where one way is good news, better or worse. How each figure is worked out gives each definition with its method version.
Download as CSV saves a row per figure; Download as PDF lays it out for paper, with a footer naming the period, who generated it and the file's SHA-256, so anyone can check a copy. The report is a record of outcomes, not a statement of compliance.
Related
- Cost · Budgets
- Guardrails · Policies and regulations
- Request logs: the calls behind every figure
- Needs attention and notices
- Risk and AI systems