Read the Compliance dashboard Enterprise
Purpose: show, for any period, that rules were applied to every call, and where they weren't: four states that add up to all calls, coverage per team, and findings scaled by traffic.
What Enterprise includes depends on the features your licence includes. On Community, Show doesn't offer it, and a link to it says "The Compliance dashboard comes with the Enterprise edition." On Community, use Request logs' guardrail filters and Policies › Guardrails › Findings instead.
Before you start
Compliance officers Enterprise, organisation admins and group admins (their teams only) have the Compliance view. Read your dashboard explains the filters.
Steps
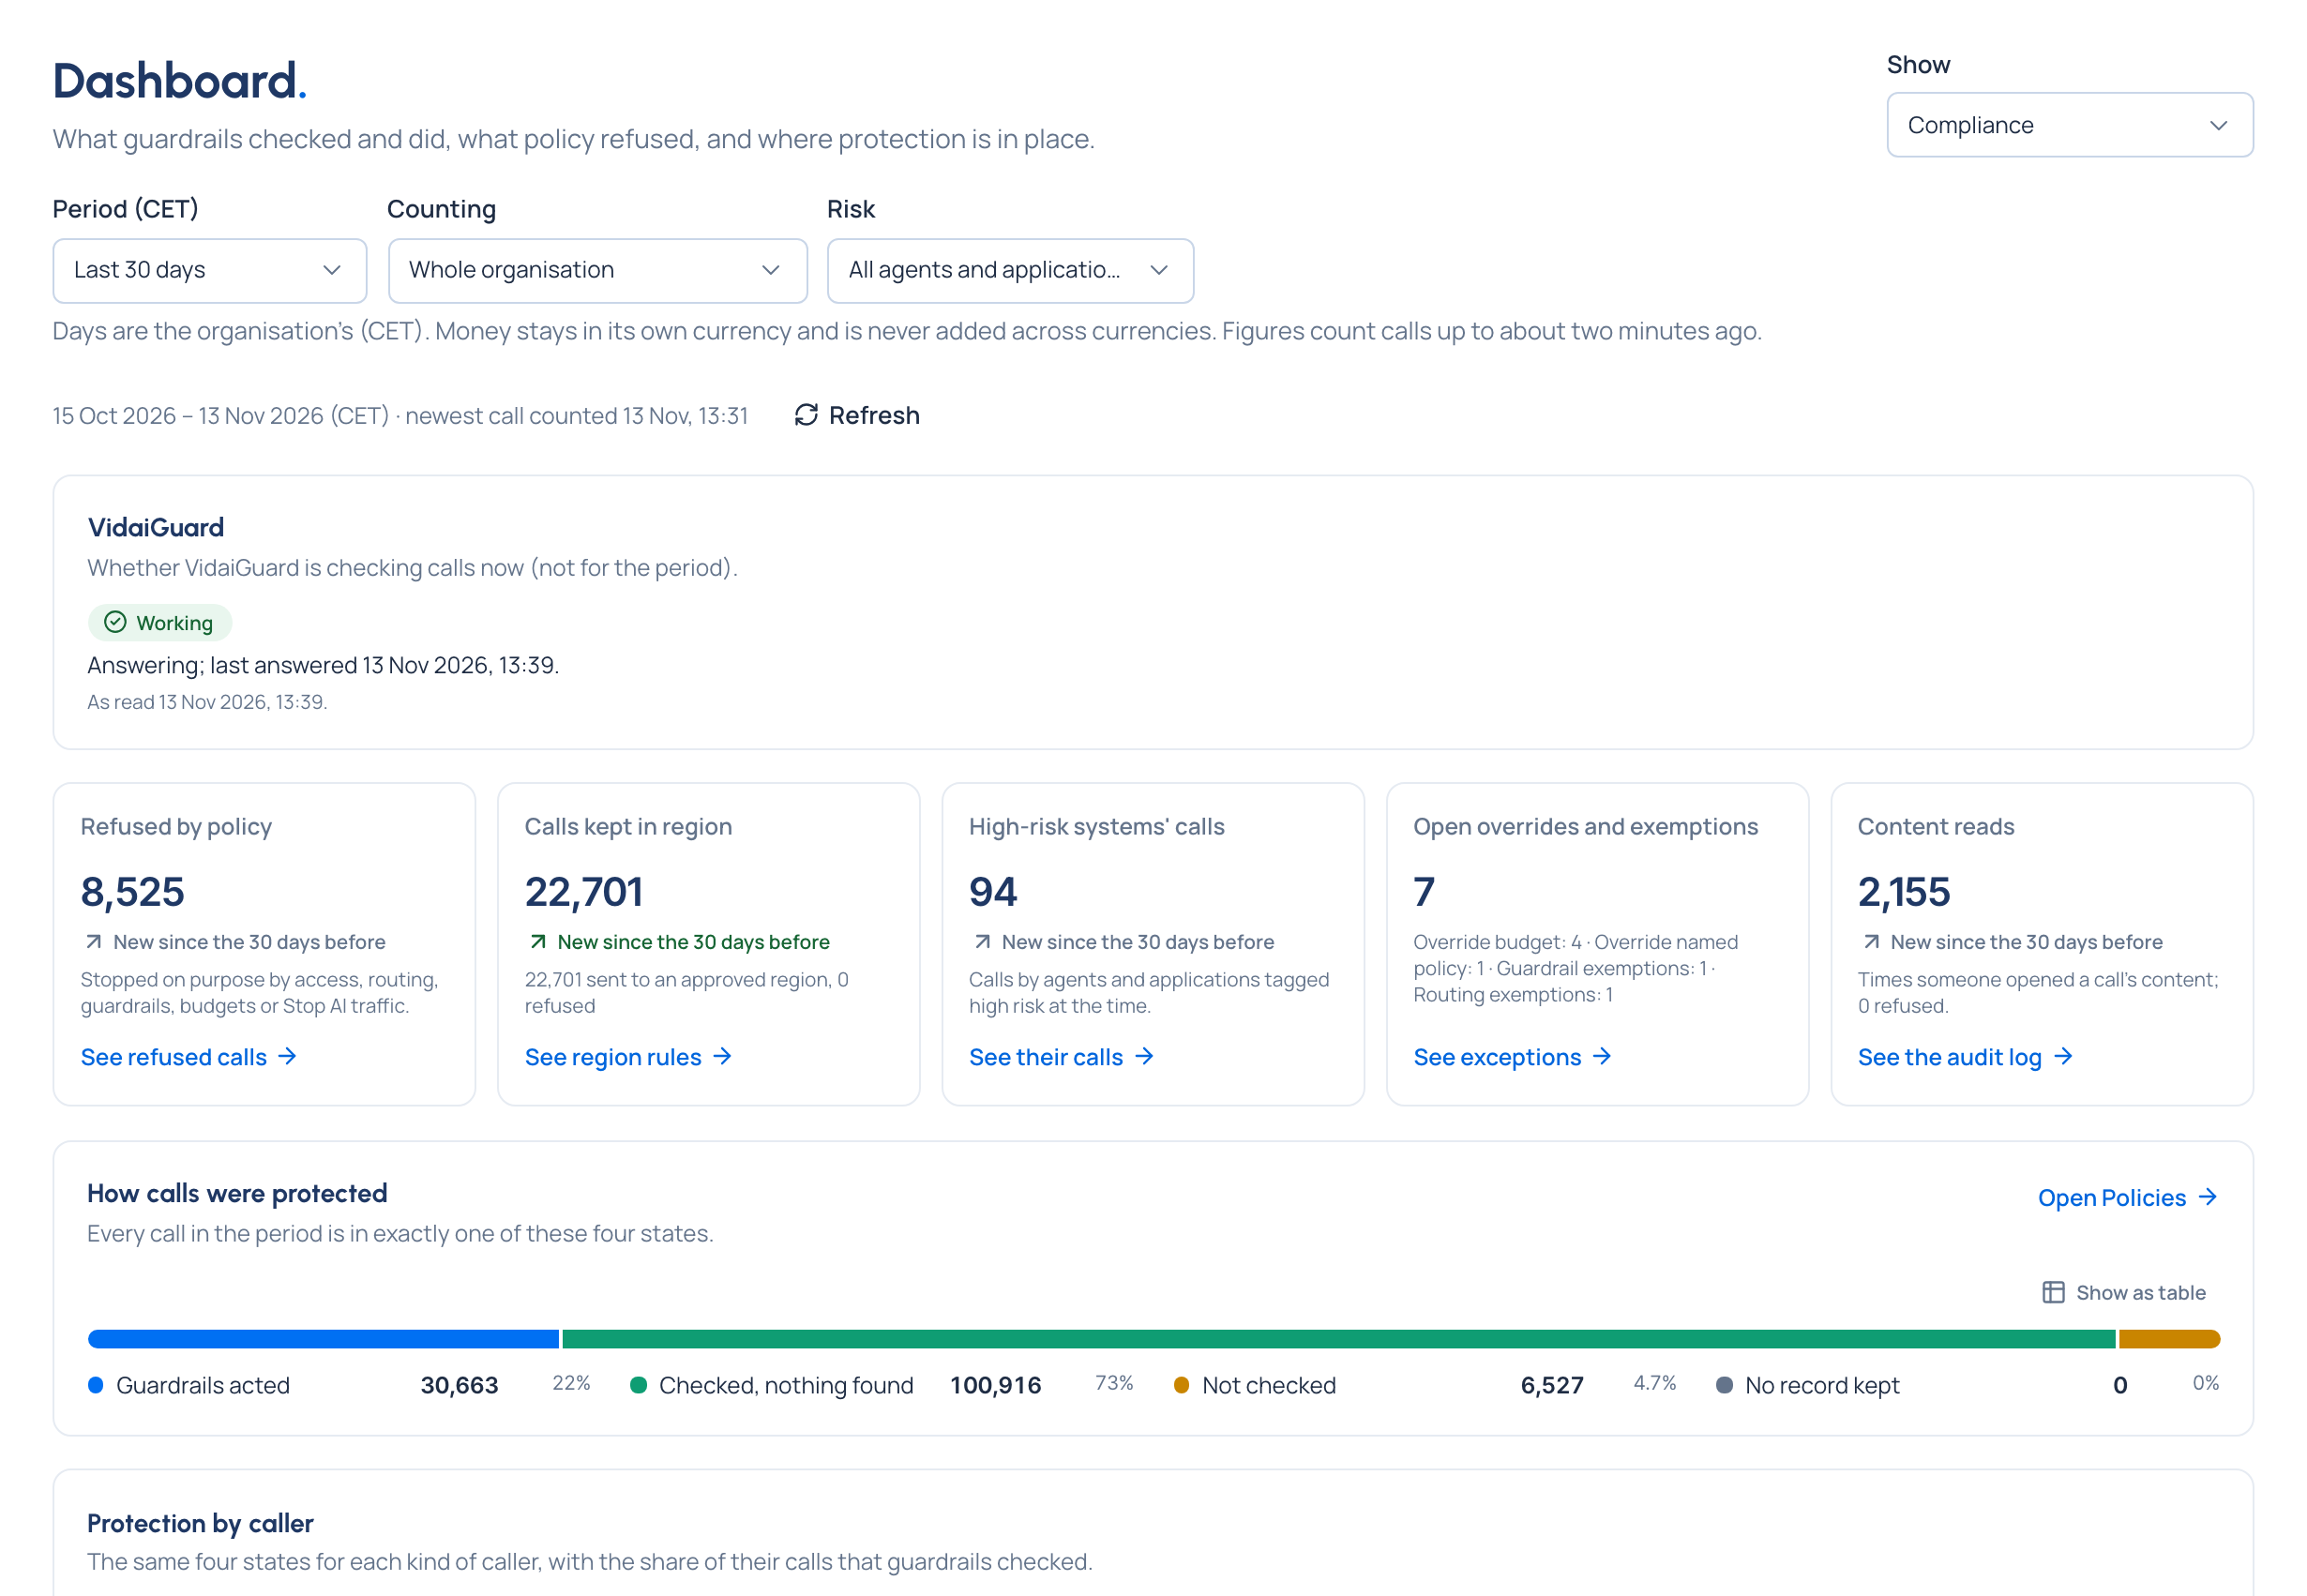
- Open Dashboard and choose Compliance in Show (Compliance officers open on it).
- Choose the Period, what you're Counting and, if you need it, a Risk level.
- Read How calls were protected: every call is in exactly one of four states, Guardrails acted, Checked, nothing found, Not checked or No record kept. Together they add up to all calls.
- Read Protection by caller: the same four states for people, agents, service accounts and unattributed calls (a call the gateway couldn't tie to one of your keys), each with the share guardrails checked, and over time.
- Read the figures: calls refused by policy, calls kept in region, calls by high-risk systems, open overrides and exemptions, and content reads; the inventory; what guardrails did (blocked, redirected, pseudonymised, masked, logged only); and what refused calls.
- Read Where protection is in place and Where findings come from (below).
- Choose a figure's link (See refused calls, See findings, See exceptions…) to open the list behind it, with the same period and filters.
Where protection is in place
Each team against each guardrail pack in use, region rules, compliance routes and VidaiGuard: Enforced, Observing (findings recorded, nothing changed), Partly (some of the team's keys) or None. This is as of now, not for the period. Teams with no keys are listed underneath. With a team chosen in Counting, it shows that team and the teams under it.
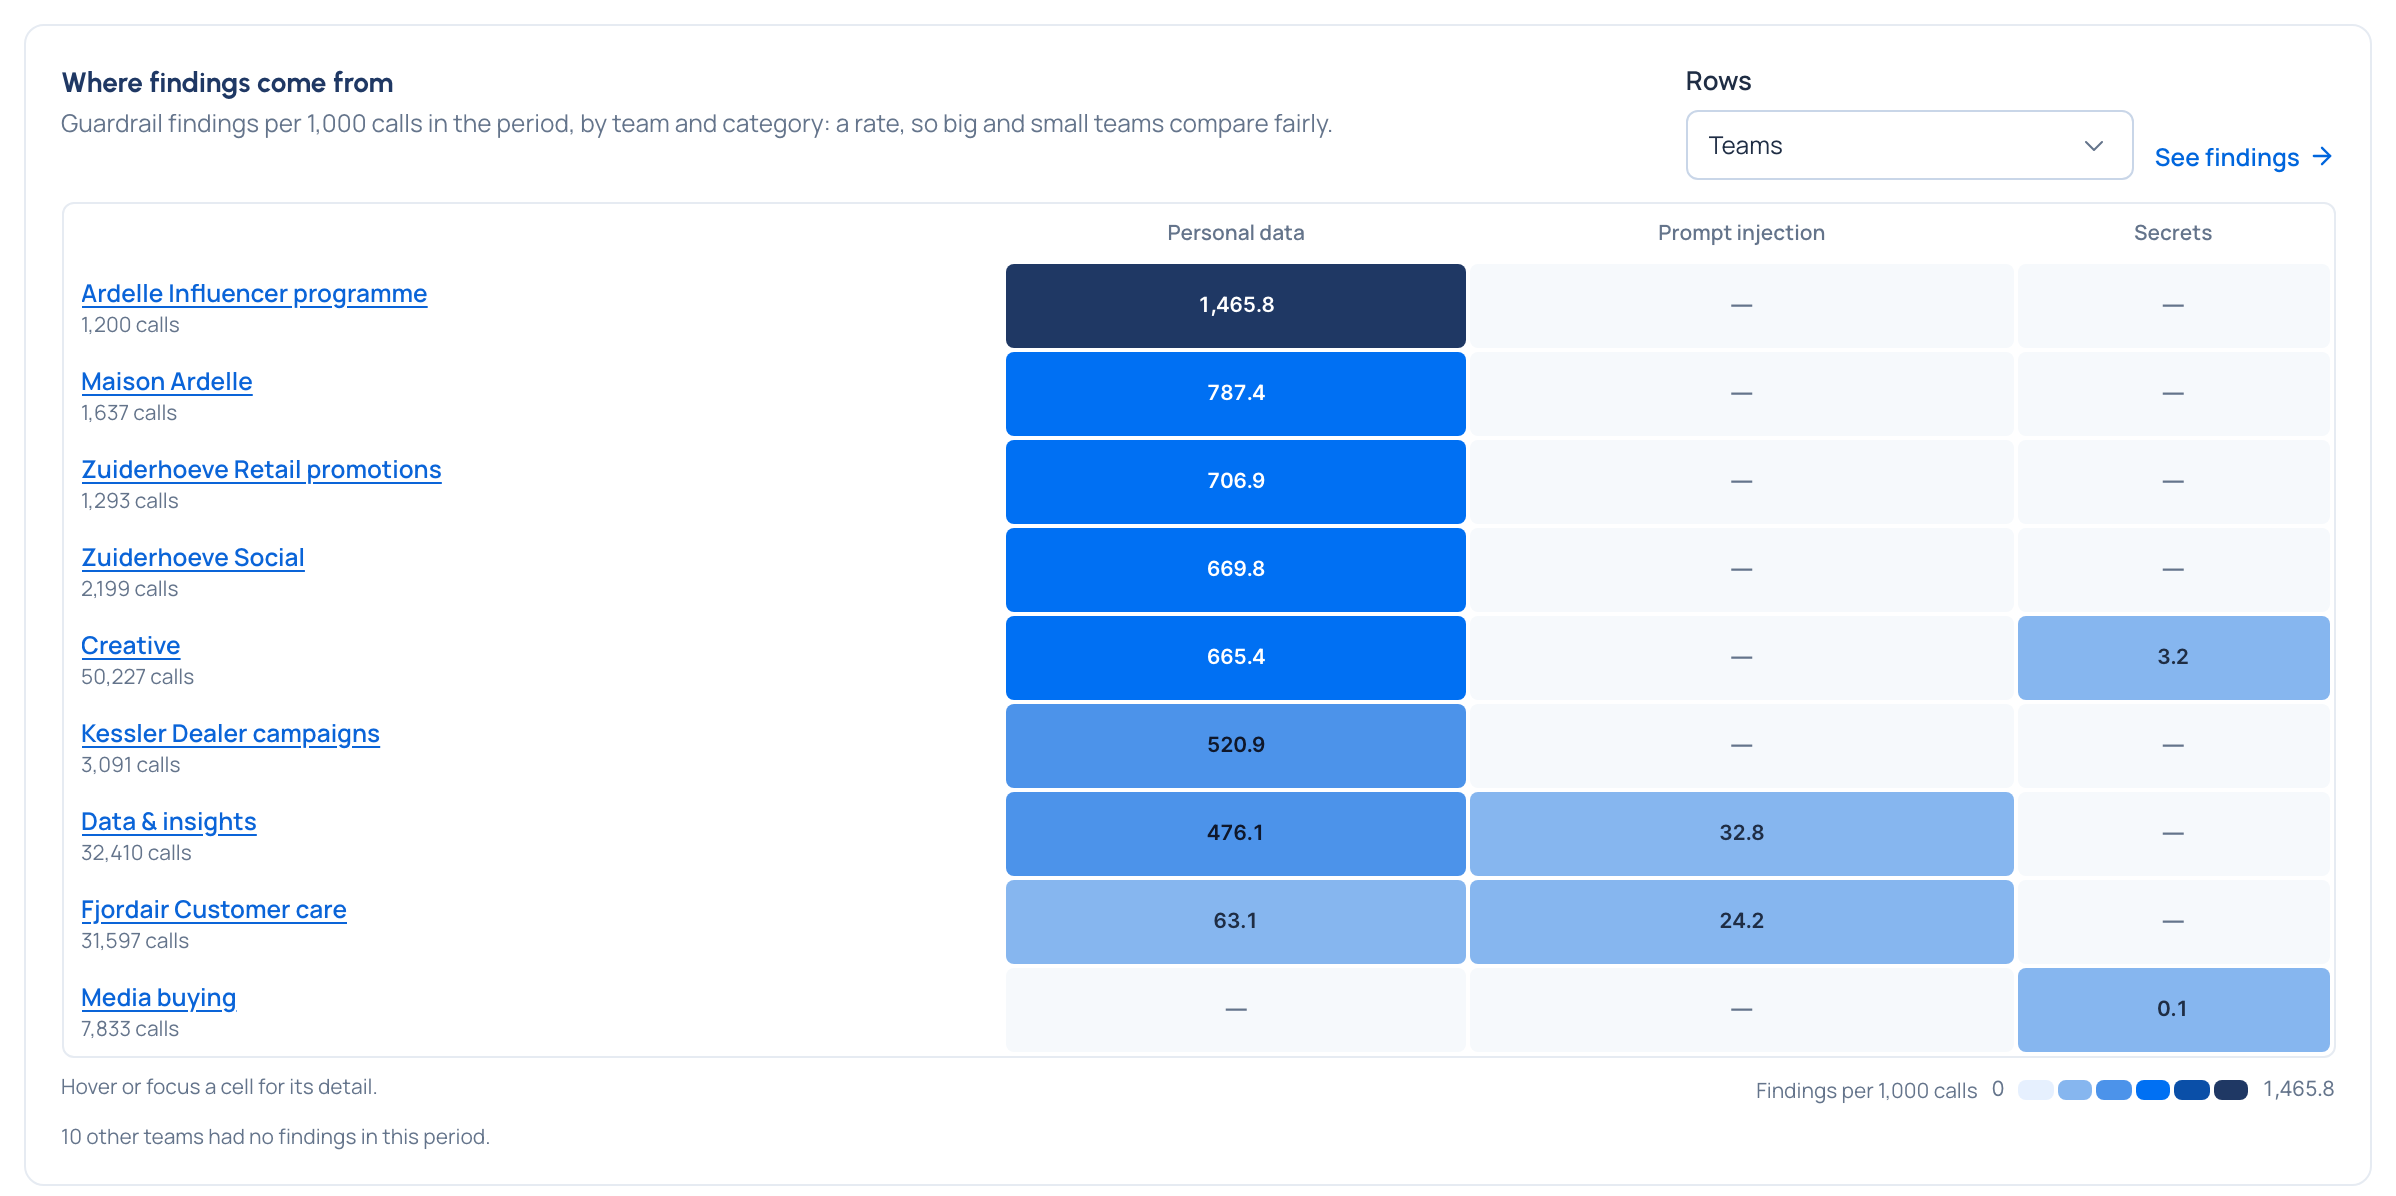
Where findings come from
Teams with guardrail findings, by category, shaded by findings per 1,000 calls, so a big team doesn't look riskier just for being big. Focus a cell for its count. Rows switches to each agent and application tagged high risk now.
VidaiGuard
The VidaiGuard tile says whether VidaiGuard is checking calls now (not for the period):
| It says | What it means |
|---|---|
| i Not set up | "Pattern checks act on their own. Settings › VidaiGuard says how to set it up." A normal state: guardrails are complete on their patterns |
| ✓ Working | Answering, with when it last answered |
| ✕ Not answering | When it last answered; calls it checks follow the strict setting meanwhile |
| Checks off | VidaiGuard checks are switched off; it says whether VidaiGuard is still reachable |
| Not known yet | No recent read, so nothing is claimed |
Check it worked
The four protection states add up to the calls in the period. The line under the filters says which days are counted and when the newest call counted was made: the dashboards count calls up to about two minutes old. Refresh reads every figure again.
Good to know
- Not available means Vidai can't give that figure, and says why; it's never shown as zero.
- Each chart has Show as table with every value.
- The Control room never says "compliant": it shows the evidence, and what isn't covered. Your auditor decides.
- Choosing an application or environment in Counting doesn't narrow the coverage grid or the heatmap; a team does.
- Open overrides, exemptions and content reads are counted for the whole organisation, and say so on a narrowed board.