Request Logs
Request Logs is every API call that's flowed through the VIDAI Control Plane: who made it, which model, how long it took, what it cost, and what happened along the way (routing rule fired? guardrail hit? fallback triggered?). It's the page you open when something specific went wrong, or when you want to read the control plane's narrative for a single request end-to-end.
The control plane logs every request. The list is searchable, filterable, and sliceable; the per-row detail drawer shows the full pipeline the control plane took.
When you'd open this page
- A user reports "my request returned 403, why?" Search by request id; the detail shows the rule that fired.
- An incident report asks "what was happening at 14:32 UTC?" Filter by time range; read what was happening.
- A specific key looks like it's calling more than expected. Filter to the key, sort by latency or cost.
- You want to verify a routing rule is actually firing. Filter by routing rule id.
- A guardrail's behaviour is being investigated. Filter by
guardrail status (
blocked,masked,logged). - Cost attribution for a specific call needs verifying. Open the row's detail and read the cost-engine breakdown.
The page at a glance
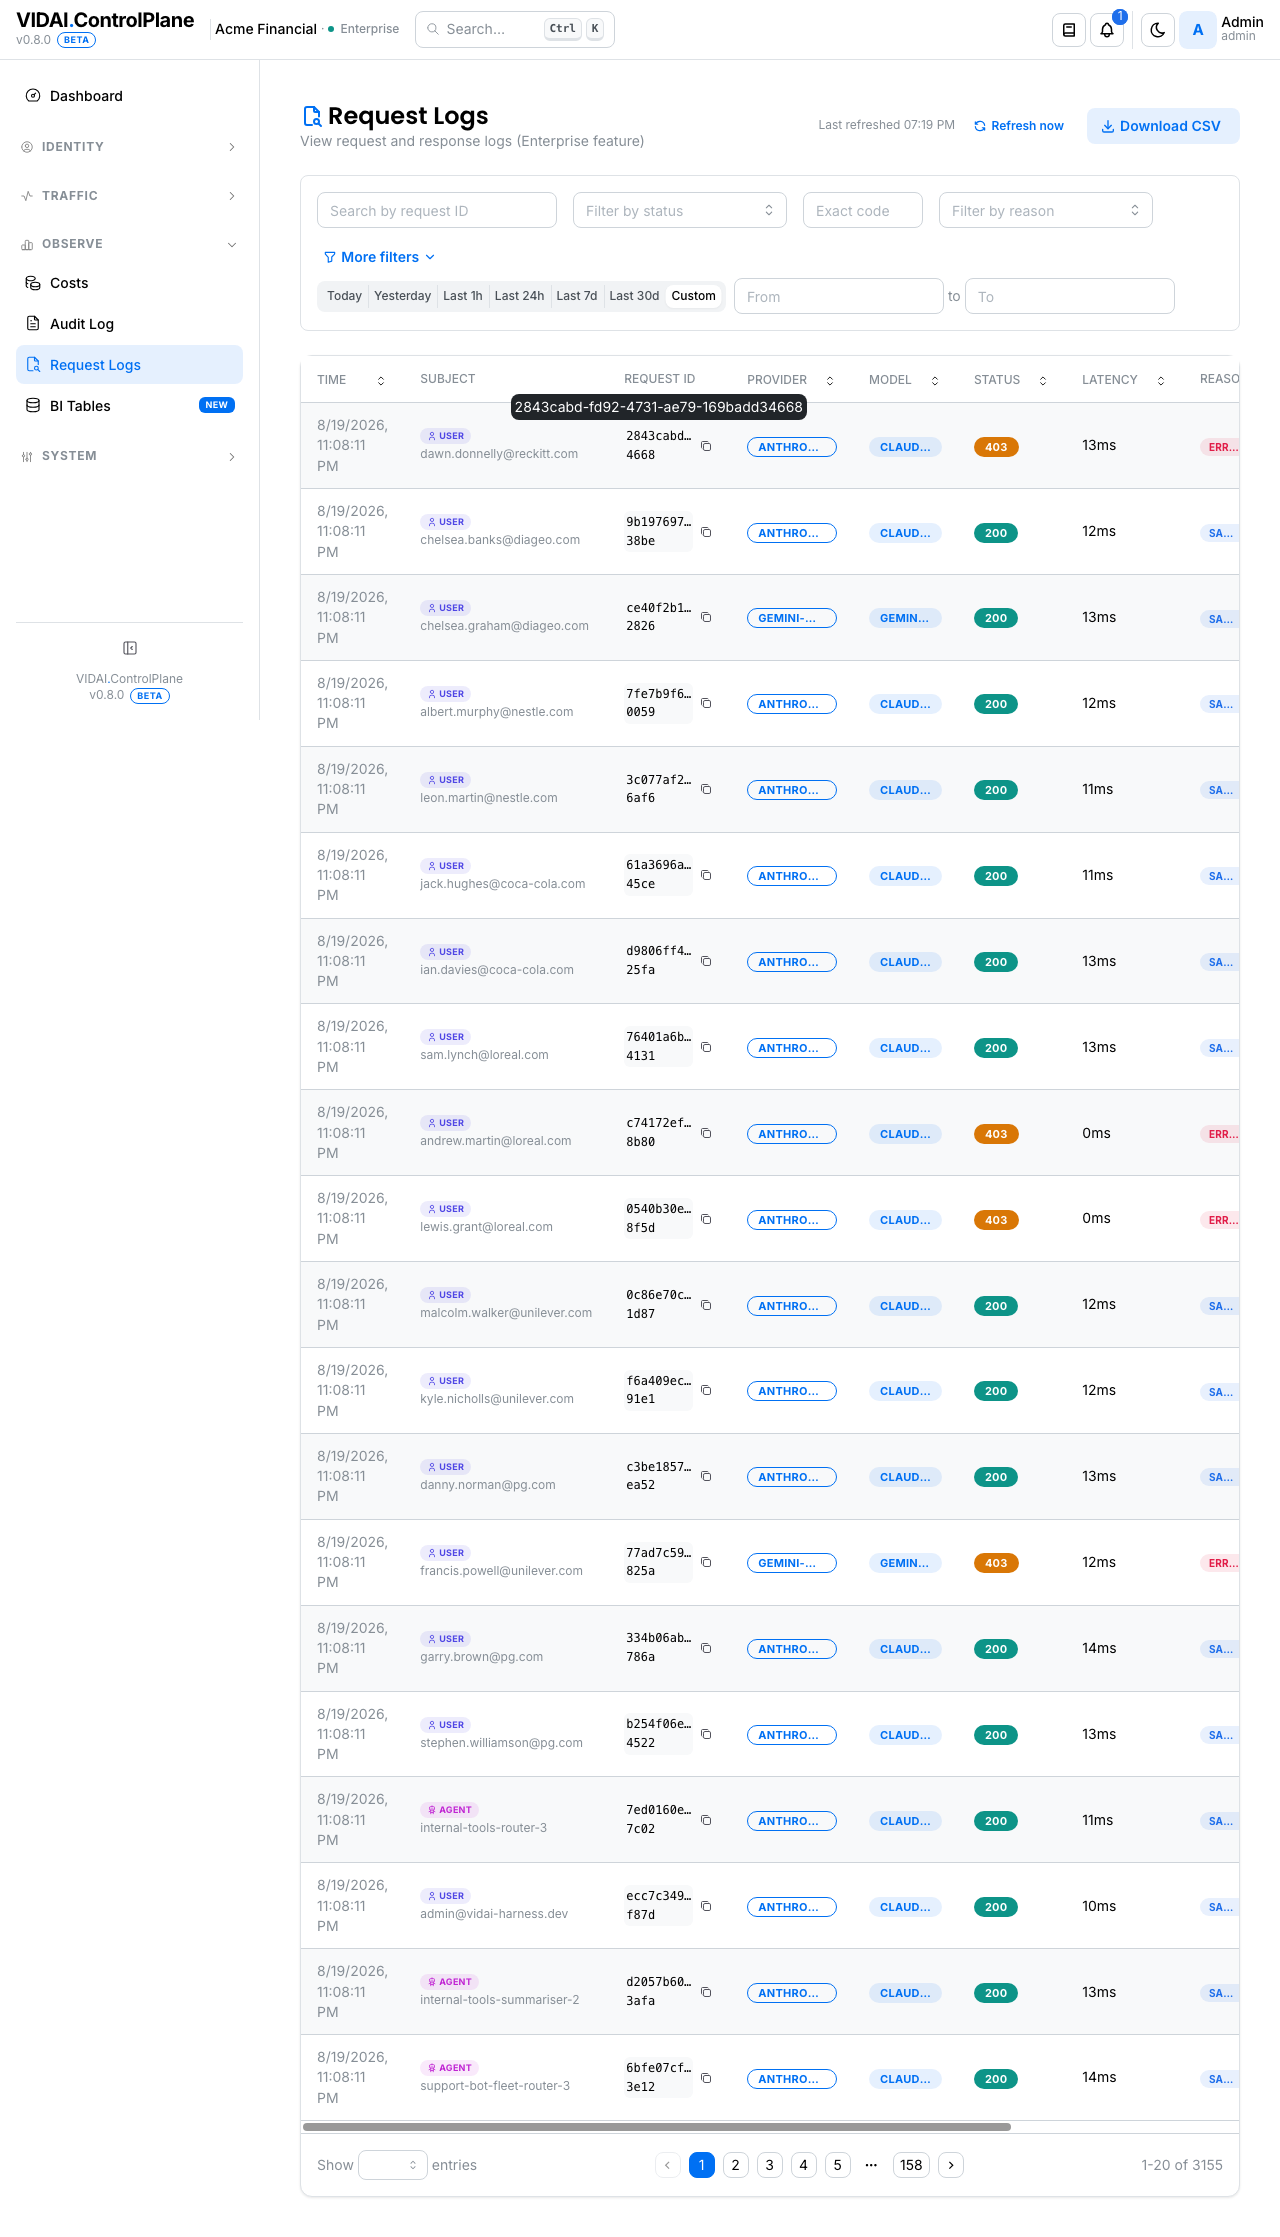
The list is reverse-chronological. Columns:
| Column | What it shows |
|---|---|
| Time | Request timestamp. |
| Subject | The owner of the API key: a Human / Agent badge with the owner identity. For human keys, the owner email; for agent keys, the agent's name (agents don't have emails). |
| Request ID | A short prefix; the full id copyable from the row. Useful for "find me this exact call." |
| Provider | The upstream that ultimately served the call. |
| Model | The model the control plane actually used (post-routing, post-fallback). When this differs from the requested model, there's a small icon. |
| Status | HTTP status code returned to the client. Coloured badge: green 2xx, yellow 4xx, red 5xx. Clickable: click the badge to pin the list to that exact status code; click again to clear. |
| Latency | End-to-end response time. |
| Reason | Log-reason badge: sampled, error, key_flagged, forced (x-trace), disabled (metadata-only). |
| Cost | Per-request cost in USD. Empty when the call was unpriced. |
Filters at the top:
- Search by request ID: exact match.
- Status: preset (2xx, 4xx, 5xx, all errors) or custom.
- Filter by reason: narrows by log-reason.
- More filters: expandable. Provider, model, API key hash, routing rule id, guardrail status, subject kind, request id, status code, time range.
💡 Pro tip. When arriving from a deep-link elsewhere ("View traffic for this rule" on Routing, "View this user's traffic" on Users), the list is pre-filtered to the right scope. An orange chip at the top reads "Filtered to
— click to clear ✕."
What you do on this page
Investigate a specific request
Goal: a user pastes a request id and asks why it failed.
- Search by request ID: paste the id.
- The list filters to the matching row.
- Click the row.
The detail drawer opens with everything the control plane recorded:
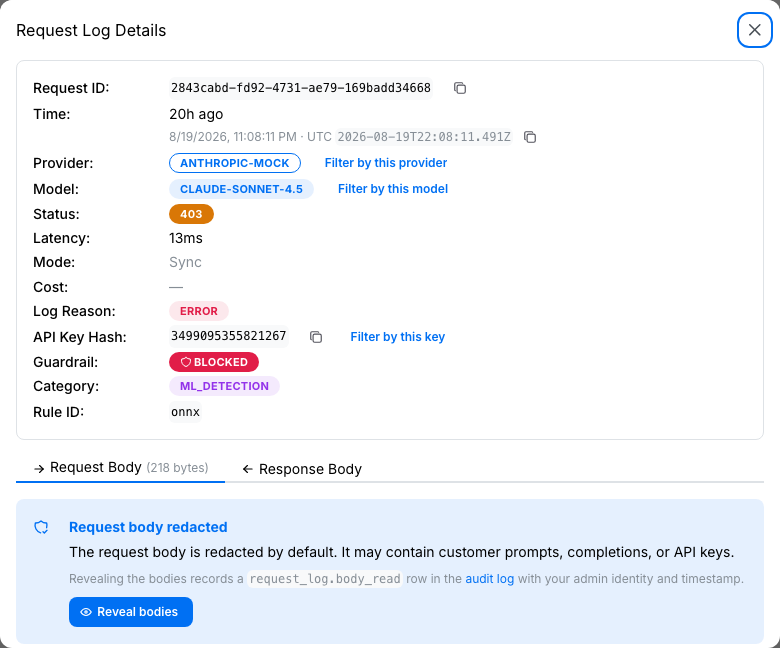
- Identity: key name, key hash, owner (user or agent), subject kind.
- Request: model requested, the call's tier + modality, the upstream model the control plane actually called, the upstream provider, full request body (subject to body-redaction config).
- Response: status code, latency, response headers
(including
x-vidai-*headers that mirror what was set on the response), and the response body. - Routing trail: if a routing rule fired, the rule id and the requested-vs-actual model.
- Guardrail: guardrail status (
passed,blocked,masked,logged,redirect), the firing rule id, the category. - Fallback:
fallback_triggered(boolean), the original provider, the original model, the upstream ultimately used. - Cost:
cost_usd,cost_breakdown_summary(per-component breakdown for input tokens × rate, output tokens × rate, cached, reasoning), and the rate-card that priced it (with a click-through to Cost Engine → that card).
Read top to bottom for the full narrative.
Find every call from a specific key
Goal: a key has been disabled; you want to see what it was doing in the days leading up.
- More filters → API Key Hash: paste the key's hash (or just the start, search prefixes match).
- Time range: last 7 days.
- The list shows everything that key called.
Sort by latency or cost to spot anomalous calls. Click any row to read the detail.
The same flow works for "every call against a specific routing rule": use the Routing rule id filter.
Filter by status code
Three ways, depending on context.
The fast path: click a Status badge. Anywhere a row has the status code you care about, click the coloured badge and the list pins to that exact code. Click again to clear. Most of the time this is what you want: one click, no form-filling.
From the dashboard. When the Error Patterns tile on the dashboard flags a spike (429 errors, 403 deny patterns, etc.), click the tile. You land here pre-pinned to the exact status code that drove the tile.
The form path. When you don't have a row with the right code on screen yet:
- Status preset →
4xx Client Error(or5xx). - More filters → Status code → enter the exact code.
- The list narrows.
Sort by Subject to see which keys are clustering. Click the top offender for context.
💡 Pro tip.
429from the upstream means an upstream provider's rate limit was hit;429from the control plane itself means a per-key or default RPM cap was hit (Rate Limits). The detail drawer shows whose limit triggered.
Verify a routing rule is firing
Goal: you just deployed a redirect rule from gpt-4o to
gpt-4o-mini for a specific team.
- More filters → Model →
gpt-4o. - The list shows recent calls to
gpt-4o. - Look for rows where the Model column shows a small "rewrite" icon; those calls were redirected.
- Click one → detail drawer's Routing trail confirms the rule id.
If you don't see any rewrites, two usual causes: the rule is scoped wrong (the team's keys aren't matching), or the rule is shadowed by a higher-priority rule. Verify with Routing → Preview.
Audit guardrail enforcement
Goal: a colleague claims their team's PII guardrail isn't firing. Verify.
- More filters → Guardrail status →
blocked(ormasked). - Optionally narrow by team via the team's API keys.
- The list shows enforcement events.
For each row, the detail drawer shows the firing rule and the triggering content. If the list is empty, the guardrail genuinely isn't firing; investigate on Guardrails (rule disabled? not in the team's effective policy?).
Export results
Once you have a filtered view, click Download CSV to export. The CSV preserves the filter; only the visible rows are exported.
📌 Worth knowing. CSV export captures up to ~10k rows. For larger pulls, use BI Tables, which has the bulk projection.
Reveal request + response bodies
Open a row's detail. The Request and Response tabs show a redacted placeholder by default; the bodies routinely contain user prompts, model completions, and sometimes API keys, so we don't auto-show them.
To see the bodies:
- Click Reveal bodies on either the Request or Response tab.
- The modal re-fetches the detail with bodies included; both tabs now show the full content.
- A row is recorded in the Audit Log under
action
request_log.body_readwith your admin identity and the timestamp. This is by design: bodies often contain sensitive content, so admin-side reveals are forensically traceable.
Closing the detail modal resets the reveal state. The next detail you open starts redacted again.
⚠️ Watch out. Every reveal click writes an audit row. If you're doing batch incident review on N rows, that's N audit rows tied to your identity. Use the bulk BI Tables Events export when you need wide-scan forensics rather than per-row reveal.
Reference
Permissions
| Role | Sees Request Logs | What |
|---|---|---|
| admin | Yes | Read every row across all keys. Full filter set. |
| bi_read_only | No | Page hidden, but BI Tables has the read-only projection. |
| user | No | Page hidden. (A regular user cannot inspect other users' or agents' traffic.) |
Filter reference
| Filter | Behaviour |
|---|---|
| Search by request ID | Exact match. |
| Status | 2xx / 4xx / 5xx / all-errors presets, plus a custom status code field. |
| Reason | One of sampled / error / key_flagged / forced / disabled. |
| Provider | Exact match: narrow to one upstream. |
| Model | Exact match against requested model. |
| API Key Hash | Prefix match. |
| Routing rule id | Exact match: useful from "View traffic" deep-links. |
| Guardrail status | One of passed / blocked / masked / logged / redirect. |
| Subject kind | human or agent_principal. |
| Start time / End time | ISO timestamps; both bounds inclusive. |
Detail drawer fields
| Section | Fields |
|---|---|
| Identity | api_key_hash, api_key_name, api_key_owner_email, api_key_owner_user_id, api_key_owner_subject_kind |
| Request | requested_model, request_body, prompt_tokens, max_tokens, tier, modality |
| Response | actual_model, status_code, latency_ms, response_body, completion_tokens, total_tokens |
| Routing | routing_rule_id (when a rule fired), x-vidai-routing-rule, x-vidai-requested-model |
| Guardrail | guardrail_status, guardrail_rule_id, guardrail_category |
| Fallback | fallback_triggered, fallback_from_provider, fallback_original_model, upstream_model_used |
| Cost | cost_usd, cost_breakdown_summary, rate_card_id |
Log reasons
| Reason | When it fires |
|---|---|
| sampled | The request was kept according to the sampling configuration. Most rows. |
| error | The request errored; logged regardless of sampling. |
| key_flagged | The key has the always-log flag (e.g. for a debug session). |
| forced | The client sent x-trace: 1; logged for debugging. |
| disabled | The request was rejected (disabled key, etc.); only metadata logged, body redacted. |
Retention + sampling
- Retention is the control plane's configured request-log retention window (typically ~90 days).
- Sampling is configurable per environment. By default, successful 2xx responses are sampled at a rate set in the deployment config; errors are always logged.
- Body redaction can be configured globally. When on, the request and response bodies are stored as length + a redaction marker rather than full text.
Limitations
- No full-text search on bodies. Search matches by id / hash / model name, not request body content. Body content is redacted-friendly by design.
- No custom column ordering. The columns are fixed; if you need a different shape, export to CSV and pivot externally.
- No per-key alerting. A spike in
429s on one key appears on this page (and the dashboard's Error Patterns tile) but isn't surfaced as a notification. - Compliance fields populate only when there's compliance
data to populate them with. The
compliance_labelcolumn - the Compliance click-through filter are most meaningful on Enterprise (where the rules wizard surfaces the compliance step). On Community, only legacy compliance- tagged rules (preserved read-only from a previous Enterprise period) populate the column.
Common questions
A request that I know happened isn't in the list.
Three usual suspects: - Sampling: successful 2xx requests on most-traffic keys are sampled. The exact request may not have been kept. Errors are always logged. - Time-range filter is too tight. Widen it. - Body redaction is on, so the search-by-body approach isn't finding the call. Search by id or key hash instead.
The Subject column shows an em-dash for some rows.
Either the row predates the denormalised owner-data rollout (older deployments) or the owning user / agent was deleted post-request and the denormalised label wasn't preserved. Use the api_key_hash to trace regardless.
The Model column shows a different model than what the client requested.
Routing rule fired or fallback kicked in. The detail drawer's Routing or Fallback section shows the rewrite. The "rewrite" icon next to the model name on the list is the at-a-glance signal.
cost_usdis null on a successful row.The cost engine's resolver couldn't price the call, typically because no rate card matches the (provider, model, tier, modality) tuple. Open Cost Engine → Rate Cards and add a manual card if needed.
Latency is huge on a row that completed normally.
Two usual suspects: (1) fallback triggered and the chain walk added time before the eventual successful upstream call; (2) a streaming response. Latency here is end-of-stream, not first-byte. The detail drawer's Fallback section shows whether fallback fired.
Two requests have the same id?
Should never happen; request ids are UUIDs. If you've seen it, take a screenshot and contact your VIDAI support contact.
The detail drawer's body shows
[REDACTED-…]for some content.Either body redaction is on globally for the deployment, or a guardrail mask rewrote the content before it was logged. The Guardrail section of the drawer shows whether mask fired.
Can I see real-time tailing of new requests?
Not as a streaming surface. The page polls every few seconds (or click Refresh now). For real- time observability, see Observability (Prometheus): the control plane's scrape endpoint is the right fit for second-level ops monitoring.
Where to go next
- Audit Log: admin actions; the configuration-side counterpart to this page's request-traffic side.
- Routing: investigate why a rule fired (or didn't).
- Guardrails: investigate why a guardrail blocked / masked.
- Fallback: investigate why fallback triggered.
- Cost Engine: drill into the cost-attribution side of any individual row.
- Dashboard: most actionable signals click-through here filtered to the relevant slice.
- BI Tables: bulk export of the request-log projection for external BI stacks.