Dashboard
The Dashboard is the at-a-glance landing page. Every section in the sidebar eventually links back here. The page is shaped to answer four kinds of question, in order of how often they come up:
- What is the control plane doing for the business? Top-of-page: the VIDAI Impact panel.
- Is anything on fire? Next: the Actionable Signals panel surfaces misconfigurations, errors, policy activity, and recent rule fires you should look at.
- Where is the money going? Cost Insights with daily burn rate, total spend, and per-provider breakdowns.
- Is policy actually working? Compliance Insights: compliance by obligation (residency / sensitive data / model access), the ISO/IEC 42001 audit-evidence state, guardrail engine status, and human-vs-agent enforcement.
Below those four, two narrower panels close the page: Lifecycle hygiene (config gaps to clean up) and Inventory (snapshot counts).
You'll come back here constantly. It's both the "is everything healthy?" surface and the "where do I drill in?" map. Almost every tile is clickable and lands you on the page that owns the underlying data, pre-filtered.
When you'd open this page
- Start of the day, after standup: sanity-check that yesterday's traffic looks normal, glance at Actionable Signals for anything new overnight.
- Finance asks "how are we doing this month?" Gateway Impact + Cost Insights answer it without leaving this page.
- A weekly admin review: every panel respects the same window selector, so flipping to "Last 30 days" rolls every panel together.
- Something feels off: Actionable Signals usually surfaces the cause (a misconfigured rule, an error spike, a guardrail block pattern).
- After making a config change (a new routing rule, a guardrail tweak, a rate-card update): verify the change shows up in the expected panel within a few minutes.
- An auditor's first stop: most compliance / cost questions bottom out in a panel here.
The page at a glance
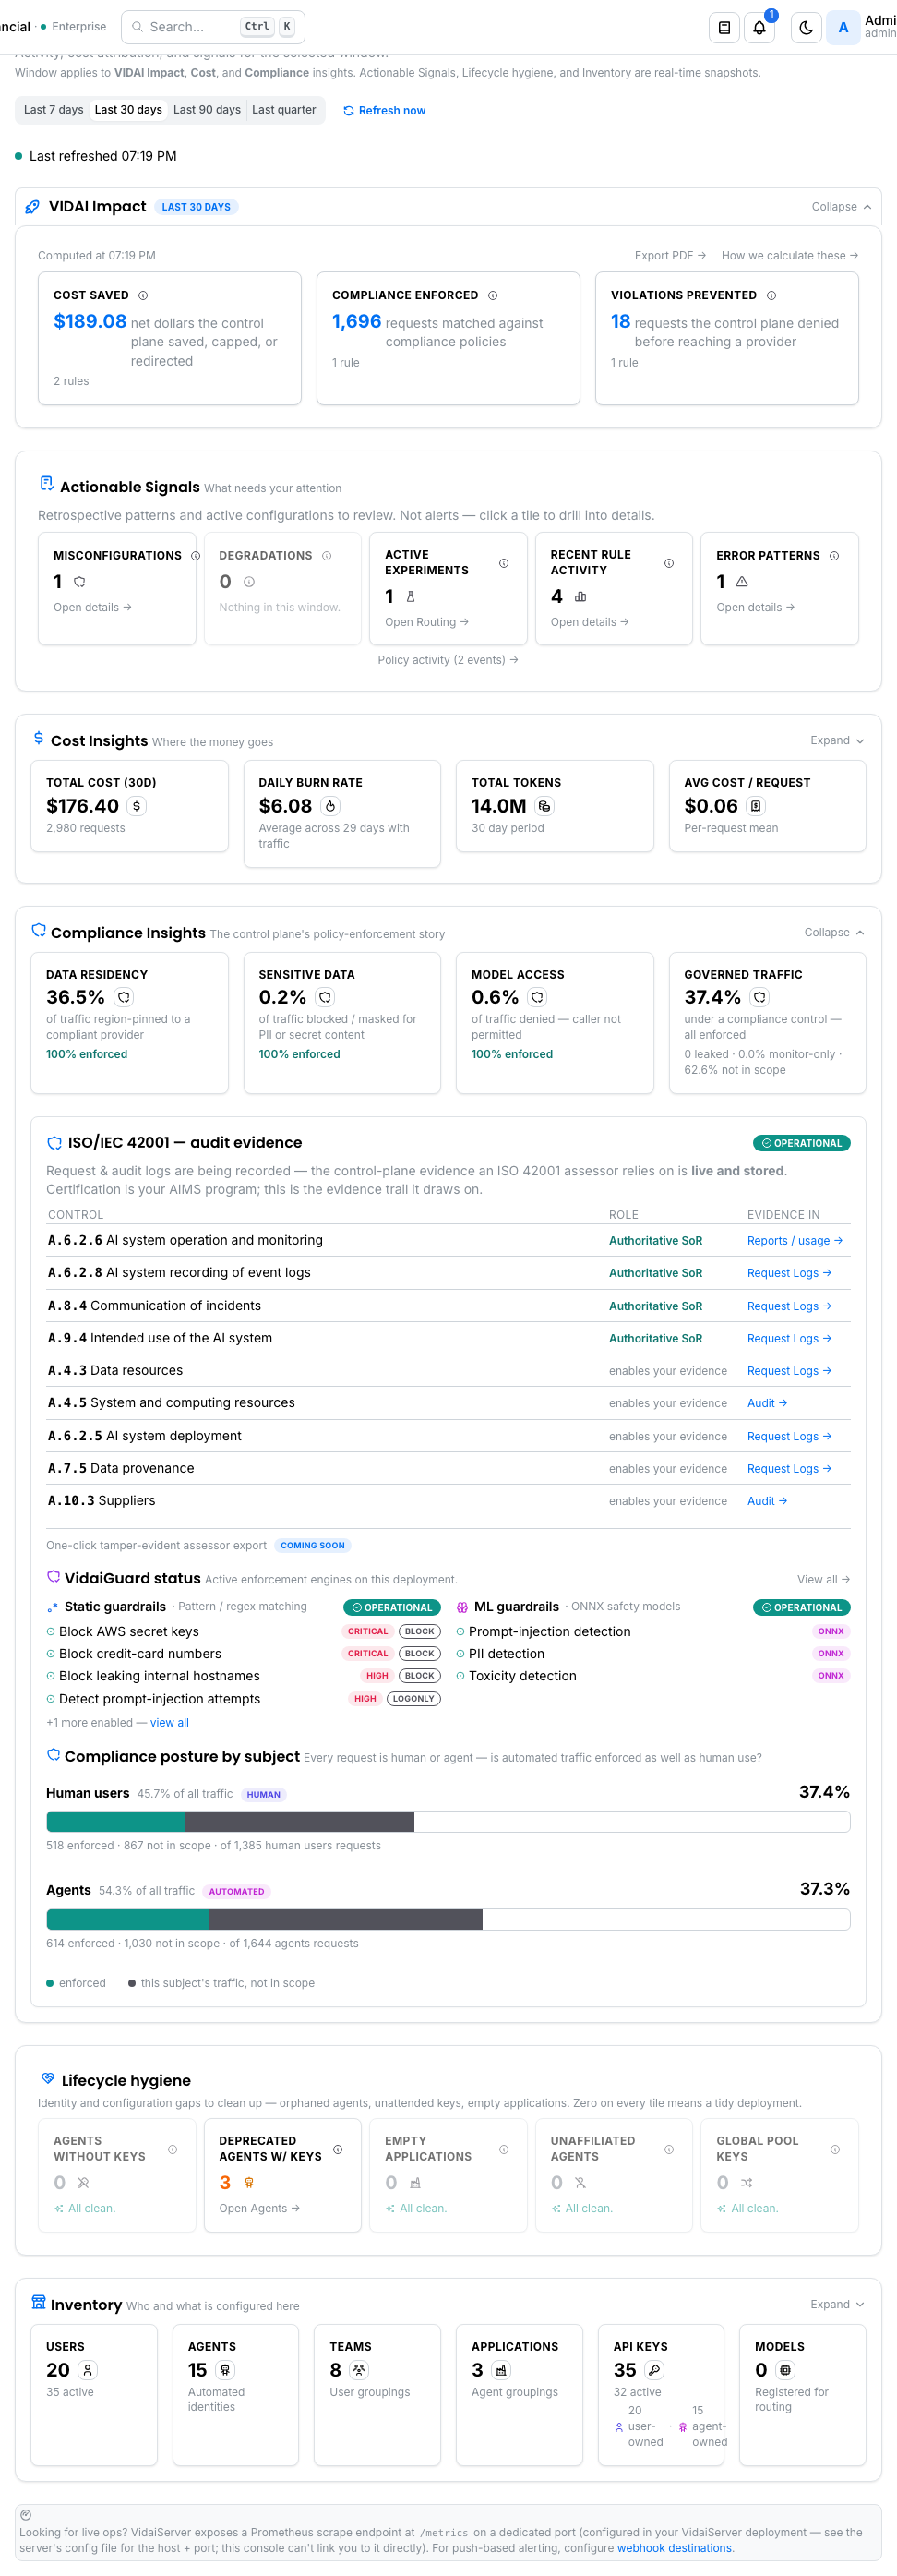
The page top to bottom:
| Panel | What it answers |
|---|---|
| Header | Window selector (7 / 30 / 90 days, last quarter), Refresh now, Last refreshed timestamp. Every panel below uses the same window. |
| VIDAI Impact | A fixed three-tile headline: Cost Saved, Compliance enforced, Violations prevented (on Community the Compliance tile shows its zero-state, because compliance attribution is Enterprise). Every other impact type the control plane tracks is in the Export PDF + breakdown. Each tile click-throughs to the contributing rules + an exclusion-toggle. |
| Actionable Signals | What needs attention right now: misconfigurations, error patterns, policy activity, recent rule fires, degradations, active experiments. Promoted to second position because it's the highest-leverage panel for an admin glancing at the page. |
| Cost Insights | Total cost, daily burn rate (only counting days with traffic), total tokens, average cost per request. Plus charts for cost-over-time and cost-by-provider. |
| Compliance Insights | Enterprise. Compliance by obligation (% of traffic residency-controlled / sensitive-data protected / model-access controlled + governed share), the ISO/IEC 42001 audit-evidence block, VidaiGuard Static + ML operational state, and human-vs-agent enforcement posture. Community deployments see a locked card. |
| Lifecycle hygiene | Five tiles surfacing identity / config gaps to clean up: agents without keys, deprecated agents w/ keys, empty applications, unaffiliated agents, global-pool keys. |
| Inventory | Snapshot counts: users, agents, teams, applications, API keys, models. |
| Footer | Pointer to push-based ops surfaces: Observability (Prometheus) and Webhooks. |
💡 Pro tip. The window selector at the top applies to every panel below. Switch to 90 days to see longer trends; switch to 7 days for "what's happening this week." The panels remember their open / collapsed state per browser, so layout you set up sticks.
What you do on this page
The dashboard is the landing page after login, so most workflows start here. Below is the natural reading order top-to-bottom and the things you'd typically follow up on.
Read the VIDAI Impact tiles
The top-of-page row answers the executive question: what is the control plane actually doing for us?
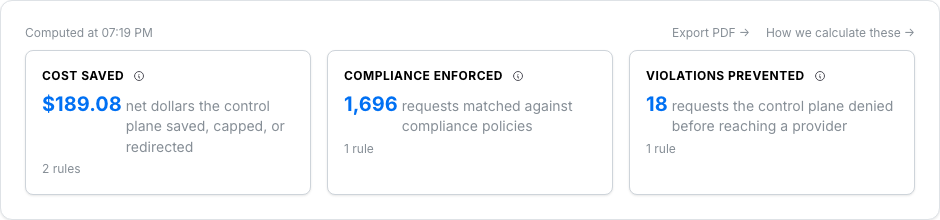
The headline is a fixed three-tile row: the three numbers executives and auditors ask for first. These three are always shown, in this order, even if one has no activity in the selected window (it shows a zero rather than disappearing, so the layout stays stable):
| Tile | Answers | What "good" looks like |
|---|---|---|
| Cost Saved | Net dollars the control plane saved, capped, or redirected this window. | Positive, growing as you add cost-saver routing rules. |
| Compliance enforced | Requests matched against compliance-tagged policies. | Steady, traceable to compliance-labelled routing rules + guardrails. |
| Violations prevented | Requests the control plane denied before reaching a provider (access-control rules). | Steady; spikes worth investigating in Request Logs. |
📌 Worth knowing. The control plane tracks more impact types than these three (provider migrations, A/B split volume, outage absorptions, and more). They aren't lost; they're in the Export PDF and the How we calculate these drawer. The on-page row stays focused on the three headline numbers so it reads cleanly at a glance; the full picture is one click away.
Each tile click-throughs to a breakdown drawer showing the specific rules that contributed and an exclusion toggle for each rule. Excluded rules don't count toward the totals, which is useful for one-off testing rules you don't want skewing the executive numbers.
📌 Worth knowing. A negative cost-impact (the control plane added cost) flips the tile copy to "Spend redirected" with a warning border. This is intentional; a routing rule that redirects to a more expensive model in some scenarios produces this honestly. Click the tile to see which rule.
How we calculate these
Click How we calculate these → above the tiles. The methodology drawer explains the formula for each metric so auditors can trace any number back to a rule or event.
💡 Pro tip. The methodology drawer is the right answer to "why did this number look weird last week?" The formula is stable; what changed is upstream (rule definitions, traffic mix, rate cards). The drawer shows what to investigate.
When the page is collapsed
VIDAI Impact has a rail-bar mode: when the panel is collapsed, the headline numbers stay visible as a single horizontal strip alongside the panel title. Useful when you want the panel out of the way but don't want to lose the executive read.
Export to PDF
Two PDF exports are available from the dashboard:
- Export PDF → in the VIDAI Impact panel header. Renders the customer name, license tier, and the full set of unit-family cards, not just the on-page three. Cost Saved, compliance enforced, violations prevented, plus requests migrated, requests split, outage absorptions, and any other impact the control plane tracked this window, followed by the control plane version block. This is the complete "send this to the CFO / auditor" surface; the on-page row is the focused headline, the PDF is the full record.
- Classic snapshot in the dashboard header. Captures the whole dashboard (VIDAI Impact + Cost + Compliance + Actionable Signals + Inventory) as a single dated PDF. The "monthly stakeholder update" surface.
Both exports respect the current window selector and any active showcase exclusions.
Drill into a specific tile
Goal: the Cost Saved tile shows $215 saved this month. You want to know which rules contributed and whether any of them is gaming the number.
- Click the Cost Saved tile.
- The breakdown drawer opens.
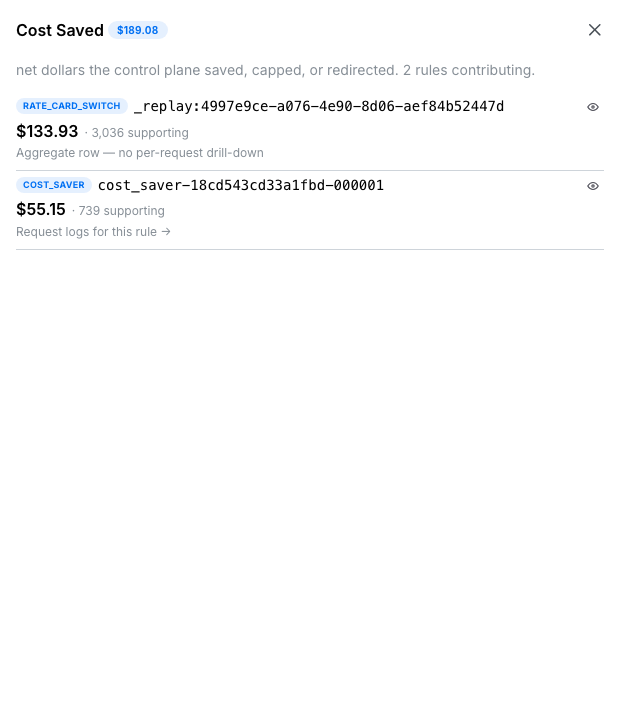
- The drawer shows:
- Each contributing rule with its share of the total.
- An exclusion toggle per rule.
- A View traffic → link per rule that opens Request Logs filtered to that rule.
If a rule looks suspicious (its contribution is too high or the rule shouldn't be running at all), excluding it removes it from the total going forward.
📌 Worth knowing. Exclusions are persistent and admin-wide. The bell in the header surfaces a count of active exclusions so the team knows what's been carved out from the executive numbers. Re-include from the drawer when ready.
Triage Actionable Signals
The Actionable Signals panel sits second on the page, right under VIDAI Impact. It's the first thing you'd look at after the executive numbers, because this is where "what needs attention" lives.
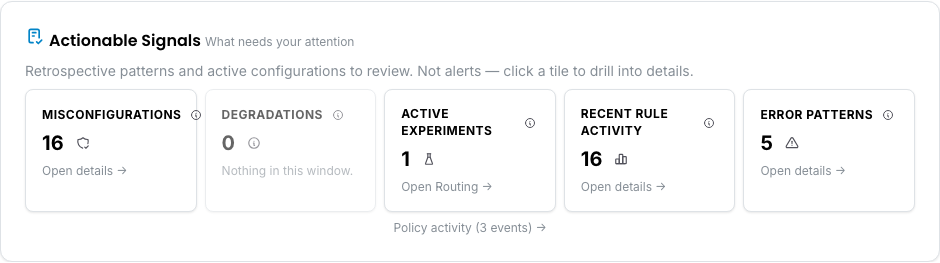
Six tiles on the panel, each a count of something that's worth your attention right now:
| Tile | What it shows |
|---|---|
| Misconfigurations | Configuration the control plane thinks isn't quite right: a routing rule whose target has no rate card, a model your traffic is hitting that has no rate card at all, an agent with no API key, a compliance pin overlapping another rule, a guardrail rule the engine thinks is being shadowed. Each row click-throughs to the page where you fix it. |
| Degradations | Per-(provider, model) outages in the window. Empty most days; fills out when a vendor has a real incident. |
| Active experiments | A/B routing rules currently running. Click-through to the routing rule list. |
| Rule fires | Recent firing events from routing rules. Lets you see which rules are actually carrying traffic. |
| Error patterns | (provider, status_code) clusters that spiked vs the prior window. Catches "something's broken with vendor X." |
| Policy activity | Guardrail blocks, deny rule fires, upstream rate-limits. The "compliance just kicked in" surface. |
Click any tile and the Signals drawer opens to that family's tab.
Inside the drawer: five tabs, one search per tab
The drawer is the full-list overflow surface for this panel. Five tabs, one per signal family:
| Tab | What you find here | Search by |
|---|---|---|
| Rule activity | Routing rules that fired recently: name, intent, count, window. Visibility-driven, not action-driven. | Rule name, intent. |
| Error patterns | Spiking error-rate dimensions: a key, agent, group, model, or provider seeing unusual 4xx/5xx volume vs prior window. | The dimension that's spiking (key id, agent name, etc.). |
| Misconfigs | The control plane's hygiene-finding output. Each row carries a stable cause slug + a one-line description + a click-through to the right fix page. | Subject, message, hint, cause. |
| Policy activity | Recent policy events: compliance pin fires, guardrail blocks/masks, access-control denies, spend caps tripping. | Event kind. |
| Degradations | Provider degradation windows: latency / error-rate baseline excursions. | Provider, reason. |
Each tab carries a count in its label, so you can see at a glance which family has the volume.
Misconfigs tab: three slices (Actionable, Standby, Quiet)
The Misconfigs tab is the densest tab and the one most worth understanding. Every row carries a cause: a stable classifier the control plane uses to describe what's wrong. The control plane tracks 18+ distinct causes today, grouped three ways for daily use:
| Slice | What it includes | When you'd care |
|---|---|---|
| Actionable (default view, also feeds the bell) | Real config gaps the admin should fix: rules shadowed by another rule, scopes that match nothing, target models that don't exist or aren't priced, models in observed traffic with no rate card, providers with many unpriced models in observed traffic, compliance pins overlapping each other, agents with no API keys, deprecated subjects still referenced, guardrail rules being shadowed by an earlier-loaded rule. | Daily glance. Should usually be a small number; if it's not, work the list top-down. |
| Standby | Defensive posture: rules that are intentionally disabled, budget rules armed and waiting for their threshold. Not broken; just not firing. | Periodic sweeps: "what defensive rules am I sitting on?" |
| Quiet | Informational: rules that haven't fired yet (settling period), rules that are old but never see traffic, and the rare cases the analyser can't classify structurally. | Monthly hygiene pass. Stale rules cleanup, mostly. |
Each row's click-through is cause-aware: the page you land on is the page where you'd actually fix the issue. A rule with no rate card, for example, doesn't dump you on Routing; it opens Cost Engine → Rate Cards with a Create-Rate-Card modal pre-filled with the offending model name. Your next click is the modal save, not "where is my model in this empty list."
Where each cause's full description lives
The drawer's per-row copy gives you the headline and the action. The full per-cause writeups (what triggers each, what to do, how the control plane evaluates rule shadows, etc.) live on the page that owns the click-through:
- Routing rules → Routing
- Rate-card causes → Cost Engine
- Agents / Applications / Providers → the Identity pages and Providers
- Guardrail rules → Guardrails
💡 Pro tip. When the Misconfigurations count is high (>10), open the drawer and triage one cause at a time rather than one row at a time. Most counts come from a single underlying issue producing N similar findings (one deprecated agent referenced by 6 rules, for instance); fix the underlying state and the count drops by N at once.
📌 Worth knowing. There are two distinct unpriced stories in the misconfig stream and they fix on different pages:
- Rule references an unpriced model (cause:
unpriced_source/unpriced_target). A rule's source or target points at a model that has no rate card. The row click-throughs to Cost Engine → Rate Cards with the create modal pre-filled.- Observed traffic hit an unpriced model (cause:
model_unpricedper-tuple, ormodel_unpriced_rollupwhen one provider has 10+ unpriced models in 30 days). Different surface: these fire on what your traffic actually used, not what your config references. The per-tuple variant click-throughs to a pre-filled create modal; the rollup lands you on the rate-cards list filtered to the provider so you can triage in bulk.📌 Worth knowing. Clicking an error-patterns tile doesn't just open Request Logs; it pre-filters to the exact status code that drove the tile (e.g. 403 for deny patterns, 429 for upstream rate-limits). You land on rows that match the headline number, not a mixed list dominated by 200s.
📌 Worth knowing. The notification bell in the header shows a curated subset of this panel: license expiries, the top few Actionable misconfigs, and showcase exclusions. The bell is for "right now"; this panel is for "the full picture, including standby and quiet."
Read Cost Insights
The Cost Insights panel sits below Actionable Signals. Four top-line metrics:
- Total Cost: what your control plane traffic cost in this window.
- Daily Burn Rate: average per-day spend, measured across days with traffic only. A deployment that's been live for 7 days viewed through a 90-day window won't have its burn rate diluted by 83 idle pre-deployment days. The sub-label spells out the divisor: "Average across N days with traffic."
- Total Tokens: aggregate tokens used.
- Avg Cost / Request: per-request mean.
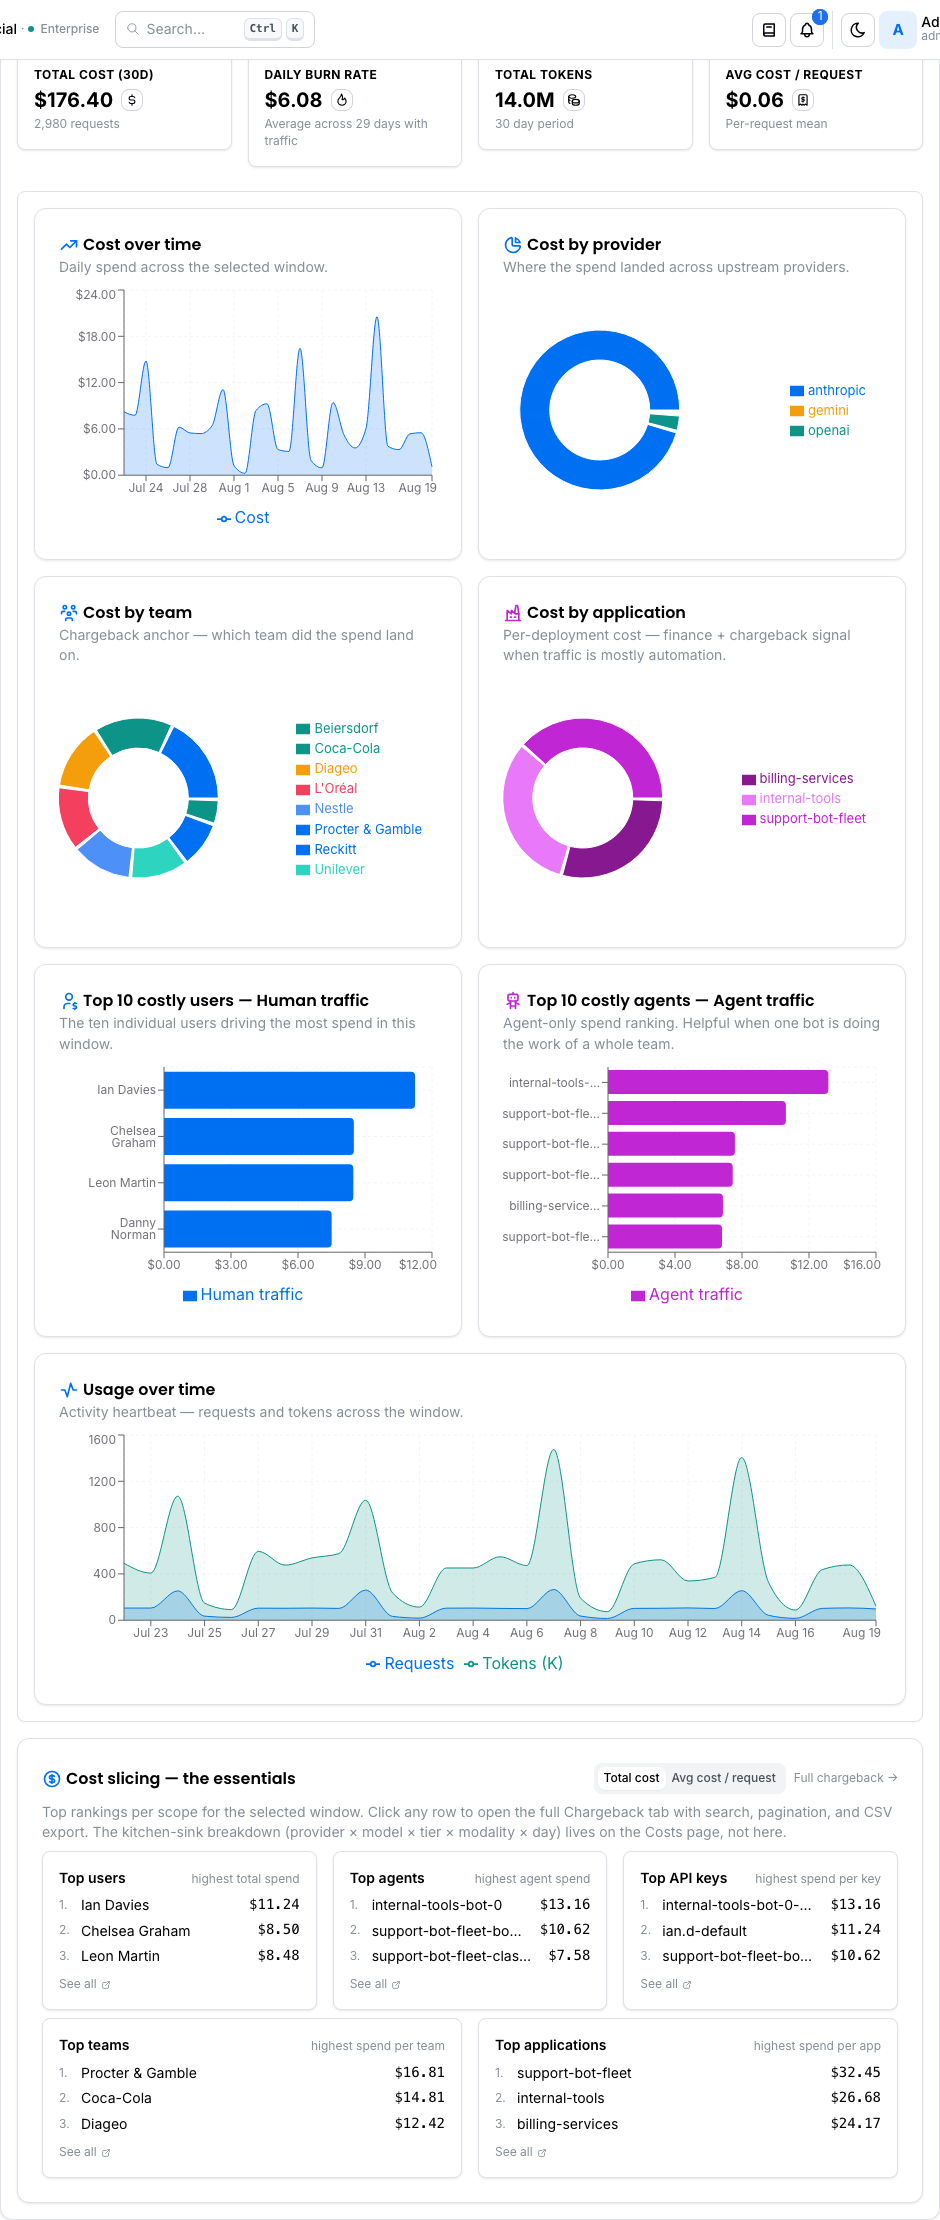
Below, six charts, split so human traffic and agent traffic never share a list (and neither do customer teams and application groups):
- Cost Over Time: daily spend stacked.
- Cost by Provider: share per upstream.
- Cost by team (pie): chargeback anchor — which team the spend lands on. Teams can represent internal departments or external customers depending on your deployment (see Groups → Team can mean two things).
- Cost by application (pie): per-deployment cost when the caller is an agent or automation. Sits alongside Cost by team so both axes are visible without choosing one.
- Top 10 costly users — Human traffic (bar): the ten individual users driving the most human-owned spend in the window.
- Top 10 costly agents — Agent traffic (bar): agent-only spend ranking. Helpful when one bot is doing the work of a whole team.
For deeper analysis, click into Costs → Chargeback. The dashboard is the headline; the dedicated Chargeback tab has the same five sections with search, sort, pagination, and CSV export.
💡 Pro tip. When an avg-cost-per-request looks wrong, the Avg Cost / Request tile is misleading on its own; small numbers of expensive calls inflate it. Look at the cost-over-time chart for the actual shape; the Costs page slices it properly.
📌 Worth knowing. The burn rate's sub-label ("Average across 7 days with traffic") is the honest reading. A reading of "—" with "No traffic in this window" means literally zero priced traffic in the selected window, usually a fresh deployment or a deployment with the cost engine still configuring.
Read Compliance Insights
🔒 Enterprise edition. The Compliance Insights panel is part of the Enterprise tier. Community deployments see a locked-card stub in this slot; the breakdown described below is the Enterprise view. See Compliance for the conceptual side.
The Compliance Insights panel speaks the compliance officer's language: obligations, not mechanism names. It answers four questions, top to bottom.
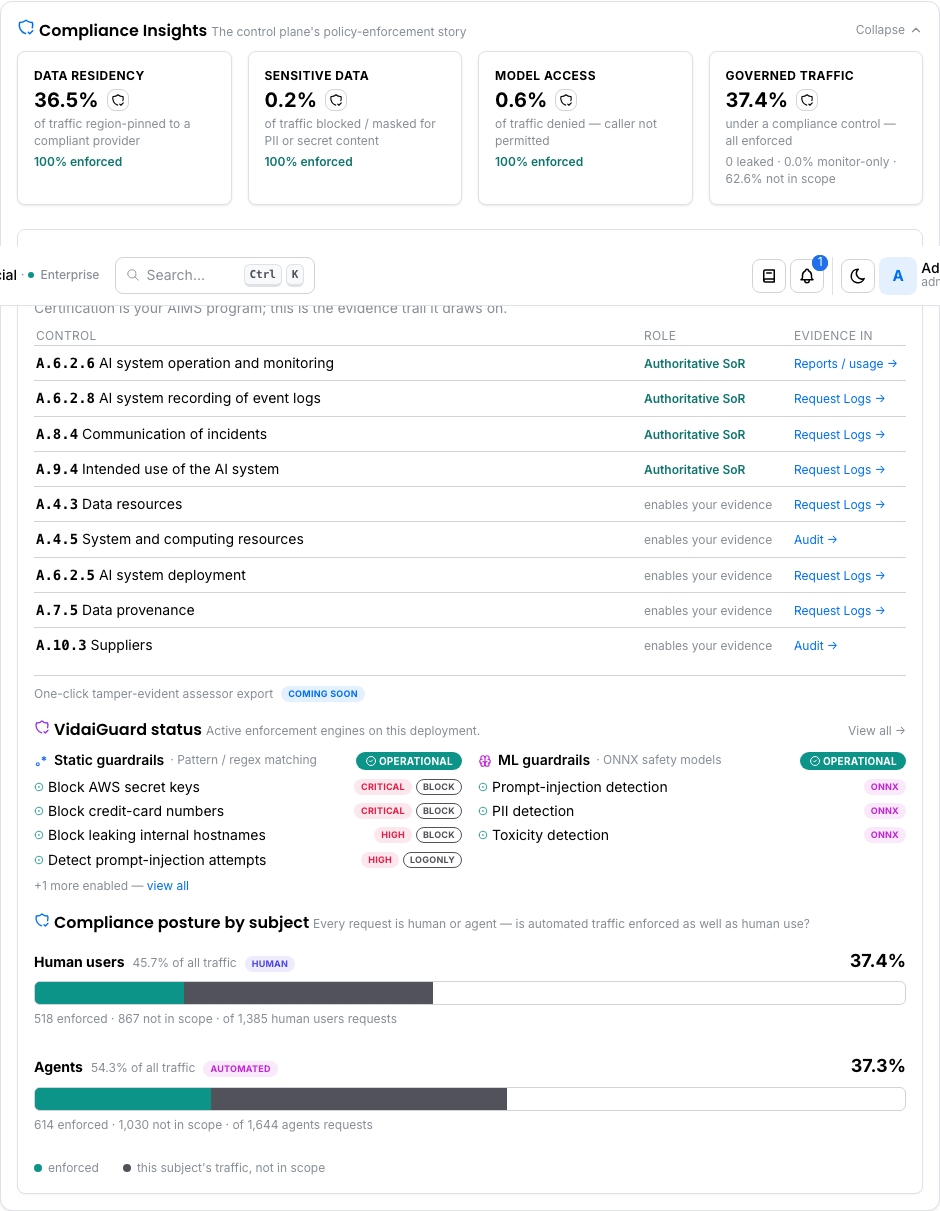
The obligation rail (the headline)
Four StatCards. The percentage is the headline; the raw request count is supporting detail.
| Card | What it answers |
|---|---|
| Data residency | % of traffic region-pinned to a compliant provider (compliance-tagged routing that switched vendor/region). |
| Sensitive data | % of traffic blocked or masked for PII or secret content (guardrail block / mask). |
| Model access | % of traffic denied because the caller wasn't permitted (deny / access-control). |
| Governed traffic | % of traffic under any compliance control, with the remainder accounted for: 0 leaked · X% monitor-only · Y% not in scope. |
The Governed traffic card answers "where's the rest of my traffic?" inline: "not in scope" is traffic no compliance control applies to, not missing data. If coverage data is unavailable for the window, the rail collapses to a single Compliance state — — card.
📌 Worth knowing. % is deliberately the headline. "1,217 requests enforced" is meaningless without a denominator; "39% of traffic under a compliance control" is the number an auditor can reason about.
ISO/IEC 42001 audit evidence
Below the rail, a per-control table shows the 9 controls VIDAI Server speaks to, each with its role (Authoritative SoR or enables your evidence) and a link to where the evidence lives. An Operational badge confirms the evidence trail is live. The footer's one-click tamper-evident assessor export · Coming soon is a roadmap line, not a readiness disclaimer.
This block has its own page, ISO/IEC 42001 audit evidence, covering the role model, the full control list, the honest-scope framing (the control plane provides operational evidence; it does not certify), and how to talk to an assessor.
VidaiGuard status
The two enforcement engines, each with its own operational state:
- Static guardrails (pattern / regex): Operational or Inactive.
- ML guardrails (ONNX safety models): Operational, Inactive, or Not deployed (the ML service isn't running on this deployment).
The states are independent on purpose: static can be healthy while ML is Not deployed, and that gap reads at a glance rather than hiding behind a healthy static engine. Most compliance regimes assume ML is on.
💡 Pro tip. View all → lands on the Guardrails page for tuning. The dashboard surface is the at-a-glance; that page is for management.
Compliance posture by subject
The last block answers "is automated / agent traffic enforced
as well as human traffic?" Every request is either a human
user or an agent; the two together are all your traffic.
Each subject is a paired bar: the bar length is that subject's
share of all traffic, the solid portion is the share of its
own traffic that's enforced, and the line below reads N
enforced · M not in scope · of T requests.
A short solid lead on the Agents bar relative to Human users is the signal that automated traffic is under-enforced: a blind spot worth tightening. On older builds without the subject split, this block honestly shows Planned — needs data.
Compliance has the deeper conceptual guide; ISO/IEC 42001 audit evidence covers the governance block.
Spot lifecycle hygiene gaps
The Lifecycle hygiene panel sits below the run-time signals and surfaces a different kind of problem: not "something is firing wrong right now," but "the identity inventory has gaps worth tidying up." Five fixed tiles. Empty (zero-count) tiles render at reduced opacity with All clean; a healthy deployment is five "All clean" tiles in a row.
| Tile | What it counts | Why it matters | What to do |
|---|---|---|---|
| Agents without keys | Agents in the registry that have no API key minted | An agent with no key can't authenticate; it's a stub. Either someone created the agent and forgot to mint, or it's been left over from a migration. | Click-through to the Agents page filtered to has_keys=false. Generate a key from the agent's edit modal, or delete the agent if it's a stub. |
| Deprecated agents w/ keys | Agents marked deprecated that still hold active keys |
A deprecated agent with keys can still authenticate. The "deprecated" mark is a signal that you intend to remove this; the keys are what allow it to keep running until you do. | Click-through to deprecated agents with keys. Disable the keys, or delete the agent (cascade) once you're sure nothing's using it. |
| Empty applications | Applications with no member agents | An application is a deployment boundary; with no member agents, it does nothing. Could be a placeholder you haven't filled in yet, could be stale. | Click-through to empty applications. Add a member agent, or delete the application if it's no longer planned. |
| Unaffiliated agents | Agents that aren't members of any application | Unaffiliated agents work fine, but they don't pick up application-level inheritance (rate limits, guardrails, group-level overrides). Usually a config oversight rather than a deliberate choice. | Click-through to unaffiliated agents. Attach to the right application unless the agent is genuinely transient. |
| Global pool keys | Keys owned by admin (pre-existing, or reassigned to the pool after their original agent was deleted) | Global-pool keys aren't scoped to a particular owner. They're available for re-use on a new agent or for revocation. | Click-through to the global pool. Re-use on a new agent, or revoke if no longer needed. |
These are advisory signals, not security alerts. Some deployments legitimately have empty applications (placeholders for features in development) or unaffiliated agents (transient test identities). The panel is asking you to look, not to fix-everything.
📌 Worth knowing. The lifecycle tiles are computed from the agents / applications / keys lists, not from the misconfig analyser. So they don't appear in the notification bell or the Actionable Signals drawer; they're a periodic sweep surface, not a "right now" surface. If you want a number to stop showing, fix the underlying state (mint the key, delete the application, attach the agent); there's no per-tile dismiss.
Read Inventory
The Inventory panel is end-of-page; it shows snapshot counts of every identity / config object in the deployment.
- Users: humans with sign-in.
- Agents: automated identities.
- Teams / Applications: the two kinds of group.
- API Keys: total + active.
- Models: registered for routing.
Mostly a sanity check ("looks like the right scale"). Click through any row to land on the relevant page.
Three header surfaces tied to the dashboard
Search ⌘K (the command palette)
The most-used affordance in the header: a Search… pill on the left of the header bar (next to the brand). Click it, or press ⌘+K on a Mac, Ctrl+K elsewhere; a spotlight overlay opens on top of any page in the console.
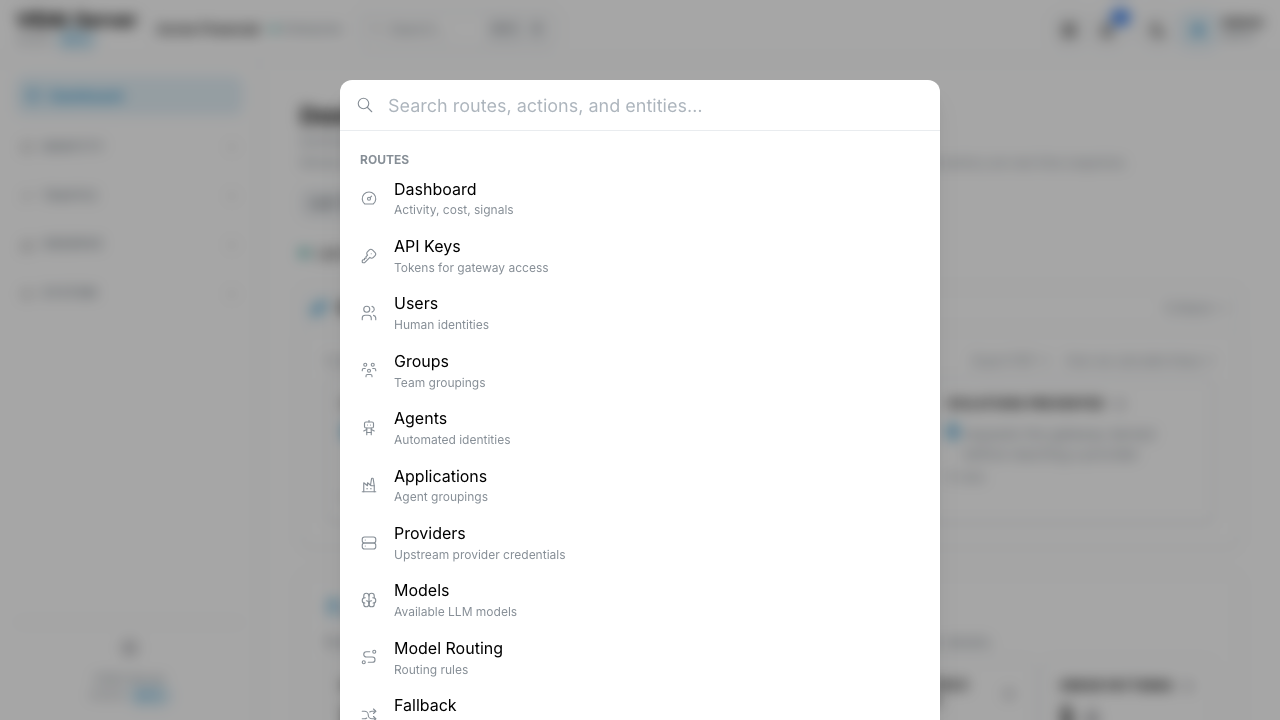
What it does:
| You type… | …and get |
|---|---|
| Nothing | A short Recent list of your last few destinations, plus the full sidebar of pages so you can jump to any of them with the keyboard. |
A page name (routing, cost, keys) |
The matching page with Enter to open it. |
| A rule, agent, application, key, model, group, webhook, or user name (or fragment) | The matching entity, grouped by type. Enter opens the right page focused on that entity. |
A free-text action (add key, add rule, change theme) |
The corresponding admin action. Enter runs it. |
Why it's the way to navigate:
- It's faster than clicking through the sidebar for any page you've used recently.
- The entity search means "the application called invoice-classifier" opens in two keystrokes, with no trip through Applications → list → search.
- It works from anywhere. If you're three pages deep in Routing and need to jump to Audit Log, ⌘K → audit → Enter beats walking back through the sidebar.
💡 Pro tip. Actions that change a setting (theme, log out) appear in the palette too. So ⌘K → dark → Enter flips the theme. Worth memorising the patterns; the palette is friendlier than the deep menus.
The notification bell
The bell in the header surfaces things directly tied to the dashboard's panels:
- License expiry warnings.
- Misconfigurations (same source as the Actionable Signals tile).
- Showcase exclusions (the rules excluded from VIDAI Impact).
Console navigation → The notification bell is the deeper guide. Worth knowing here because the bell's unread count is your "hey, look at the dashboard" prompt.
The recompute-costs pill
Next to the bell is a smaller affordance: a Recompute costs pill that appears only when something has changed that may have left your historical chargeback out of step with your current rate cards.
When does it show?
- After a rate-card sync produces deltas (a vendor's prices moved, the control plane's catalogue picked up the change).
- After someone edits a manual rate-card override.
What does it do?
- Click it and you land on Cost Healing (Cost Engine) with the affected window pre-filled. You preview the impact of recomputing your ledger against the new rates, then commit if the delta looks right.
The pill clears the moment you commit a recompute that covers the change. No dismiss button: the action itself is the acknowledgement.
📌 Worth knowing. The pill is informational, not alarming. Past chargeback rows aren't wrong (they recorded what was actually charged at the time); the pill is asking "do you want them rewritten now that rates have moved?" If you don't, ignore it; if you do, click through. Either is correct depending on your finance practice.
Reference
Permissions
| Role | Sees Dashboard | What's visible |
|---|---|---|
| admin | Yes | All panels. |
| bi_read_only | Yes | All panels in read-only mode. Cost / Compliance Insights, Inventory all visible. Tile click-throughs to BI Tables only (other admin pages are hidden). |
| user | Yes (limited) | Welcome page, no admin panels. |
Window selector
| Option | Use for |
|---|---|
| Last 7 days | Day-to-day watch. Rapid feedback on recent changes. |
| Last 30 days | Default. Monthly executive view. |
| Last 90 days | Quarterly trends. Slow-moving compliance / cost stories. |
| Last quarter | Calendar quarter (Q1 / Q2 / etc.). Useful when finance reports align to calendar quarters. |
Refresh behaviour
- Auto-refresh: every 5 minutes, panels poll their upstream data.
- Manual refresh: click Refresh now in the header to pull fresh data on demand.
- Last refreshed label: shows the timestamp of the most recent successful refresh.
Some panels (VIDAI Impact, Compliance, Inventory) have their own refresh state that updates independently. The header timestamp is the most recent across all panels.
What's logged
Dashboard reads don't write to the audit log; they're non-mutating. Mutations made via tile drill-throughs (e.g. toggling a showcase exclusion) are logged on the underlying surface (Routing, Showcase Exclusions, etc.).
Limitations
A few honest gaps worth knowing about:
- No one-click ISO assessor export yet. The ISO/IEC 42001 block's tamper-evident export is on the roadmap (shown as "Coming soon"). The evidence data is retrievable today from Request Logs, Audit, and Reports; see ISO/IEC 42001 audit evidence for the interim process.
- Obligation rail is current-window-only. No coverage-trend-over-time chart; use the window selector to compare periods manually.
- Cost-impact methodology drawer. The numbers are computed against the cost ledger's current values. If a rate card changed mid-window, the showcase numbers you see today may not match what you'd see after a ledger recompute. Run Cost Healing if your finance process needs the alignment.
- Auto-refresh in background tabs. Browsers throttle
hidden-tab timers heavily, so a backgrounded dashboard
can show a 30-minute stale
Last refreshedtimestamp. Click the tab forward and the next refresh fires.
Common questions
The Cost Saved tile shows $0 but I have routing rules running. Why?
Two usual suspects: - The cost engine doesn't have rate cards for the source and target models, so it can't compute the saving. Open Cost Engine → Rate Cards and confirm both sides are priced. - The window has no traffic on the rules in question. The Routing page's "Last fired" column tells you when each rule actually matched a request.
A VIDAI Impact tile is wildly different from yesterday and I didn't change anything.
Likely causes: - A new exclusion was added (the bell will tell you). - A rate card was updated, retroactively repricing traffic. The recompute-costs pill will appear if so. - A traffic spike on a model with very different pricing skewed the average. Click into the tile → breakdown drawer to see the contributing rules and their per-rule contribution.
Compliance Enforced is high. Does that mean we're compliant?
No. It means the control plane fired compliance-tagged rules a lot. Whether your overall posture is compliant is a separate question (you might have intentional gaps, you might have un-tagged rules that should be tagged). Compliance has the deeper guide.
Why is Actionable Signals at the top of the page rather than buried lower?
Because it's the highest-leverage panel for an admin glancing at the page. The number that matters more than any other on a normal day is "is anything broken right now?" and that's what Actionable Signals tells you. Cost and compliance numbers move slowly; error patterns and misconfigurations need response in minutes. Position reflects priority.
My Misconfigurations count won't go down even after I fixed the issues.
The misconfig findings are computed on a periodic schedule (every few minutes typically), not in real-time after each save. Refresh after a few minutes; if the count's still not dropping, the issue you "fixed" might not match what the finding is checking for. Open the drawer and read each finding's message; they include the exact subject id.
The dashboard panels are all zero / "all clean". Did something break?
Probably not. A fresh deployment with no traffic shows zeros across the board until the first calls arrive. The 30-day default window catches anything from the past month; if you've been running longer and the panels are still empty, switch the window to 90 days and check.
The Compliance Insights panel's "Governed traffic" is well under 100%. Is something wrong?
Usually not. "Governed traffic" is the share of traffic under some compliance control. The rest is traffic no compliance control applies to: ordinary requests that aren't residency-pinned, don't trip a guardrail, and aren't denied. The card spells it out:
0 leaked · X%
monitor-only · Y% not in scope
. A higher number isn't automatically better; it depends how much of your traffic should be under a control. See Compliance.My team uses bi_read_only. They can see the dashboard but tile click-throughs don't all work.
Correct. Many click-throughs land on admin pages (Routing, Providers, Audit). bi_read_only only sees the Dashboard + BI Tables, so tiles that try to drill into Routing or similar simply don't navigate. The dashboard surfaces the data; admin pages are for admins.
The Last Refreshed timestamp is from 30 minutes ago.
Auto-refresh is every 5 minutes; if the timestamp is older, either the page was open in a background tab (browsers throttle hidden tabs' timers) or a refresh failed silently. Click Refresh now to pull fresh data; the timestamp updates on success.
What's the Search ⌘K pill in the header for? I haven't used a command palette before.
It's a keyboard-first way to navigate. Press ⌘+K (Mac) or Ctrl+K from anywhere in the console; a search box opens. Type a page name, a rule name, an agent or application or key name, or an action like "add key" or "change theme." Press Enter and you're there. It's faster than the sidebar for any place you've been recently, and the only fast way to find a specific entity by name. The pill in the header is just the click affordance for the same overlay; the keyboard shortcut works without opening the pill.
What's the difference between Actionable Signals and the notification bell?
The bell is a header-bar surface that surfaces a handful of curated, dismiss-able items (license, misconfigs, showcase exclusions). Actionable Signals is a full dashboard panel showing every signal in the control plane's analytic projection (misconfigs + degradations + experiments + rule fires + error patterns + policy activity). The bell is "the few things you should look at right now"; the panel is "the full surface I can drill into."
What's the recompute-costs pill in the header?
It appears when something has changed that might leave your historical chargeback out of step with your current rate cards: typically a sync that picked up new vendor prices or a manual override someone edited. Click it and you land on Cost Healing pre-filled with the affected window. The pill clears once you commit a recompute that covers the change.
I want a stale signal to stop showing on the dashboard.
Two paths: - For misconfigurations: fix the underlying issue (the finding will drop on the next computation). - For tile-level "this rule shouldn't count toward VIDAI Impact": the breakdown drawer's exclusion toggle. Excluded rules don't contribute to the tile total.
Where to go next
The dashboard is where both flagship stories read at a glance. For the why behind the numbers, start with the story front-doors:
- Compliance & governance: the leading story. What the obligation rail, ISO block, and subject posture on this page actually prove.
- Cost control: the spend story behind the VIDAI Impact "Cost Saved" tile and Cost Insights.
- Cost Engine: drill into cost details. The dashboard's Cost Insights panel is the at-a-glance; cost-engine has the slicing, the rate-card management, and Cost Healing.
- Compliance: deep-dive on the Compliance Insights panel (obligation rail, VidaiGuard status, human/agent posture, and rule tagging).
- ISO/IEC 42001 audit evidence: the governance block on the panel (role model, control list, honest scope).
- Routing: the rules that drive VIDAI Impact tiles.
- Guardrails: manage the static and ML guardrails surfaced in the VidaiGuard status card.
- Audit Log: every change captured here is in the audit log.
- Request Logs: every tile that click-throughs to filtered traffic lands here.
- Console navigation: the bell, the recompute-costs pill, and the new sidebar context for everything you click out to from the dashboard.