BI Tables
🔒 Enterprise edition. BI Tables is part of the Enterprise tier. Community deployments see a locked-card stub at this URL with no live data. See Licensing & tiers for the full feature breakdown.
BI Tables is the data-export surface for external Business Intelligence stacks: Snowflake, BigQuery, Looker, Tableau, your in-house data warehouse. Where the rest of the console answers "what's happening?" interactively, this page is for "give me a CSV I can pull into our reporting pipeline."
The page exposes four projections of VIDAI Control Plane data, each on its own tab, each with a Download CSV button. The same projections are reachable via a read-only role designed for BI service accounts.
When you'd open this page
- Finance needs the per-team monthly cost summary as a CSV for their billing system.
- Your BI team is setting up a nightly extract into a data warehouse: the projections here are what they pull.
- Compliance asks for a Q1 audit-log export to attach to a regulatory filing.
- An incident review needs the full event log over a specific window for forensic analysis.
- You want a roll-up that the dashboard's panels don't show in a downloadable shape.
When to use BI Tables vs other data surfaces
| Question | Best surface |
|---|---|
| "Why did this specific call fail?" | Request Logs: interactive, filterable, per-call detail. |
| "Who changed this rule?" | Audit Log: interactive admin-action history. |
| "Cost this month, headline numbers" | Dashboard: Cost Insights panel. |
| "Cost slicing: top users / keys / models" | Cost Engine → Cost Slicing. |
| "Bulk CSV export for our BI / SIEM / data warehouse" | BI Tables (this page). |
| "Schema-stable, paginated extract for an automated pipeline" | BI Tables (this page). |
The other pages are for people clicking around; this page is for systems pulling data.
The page at a glance
Four tabs, each a separate projection:
| Tab | What it projects | Typical use |
|---|---|---|
| Usage | Per-(time bucket, scope) request counts + cost rollup. The high-level "spend over time" shape. | Finance chargeback. Monthly summary reports. |
| Events | Per-request rows: every call the control plane has logged. Wider columns than Request Logs (includes fields the in-console list doesn't show). | Incident forensics. Streaming pipelines that need the raw event stream. |
| Aggregates | Pre-computed roll-ups across configurable scope + metric pairs. Cached for performance. | Dashboards where you don't want to recompute every load. |
| Audit | Same as the in-console Audit Log but in CSV-export shape. | Compliance evidence packs. SIEM ingestion. |
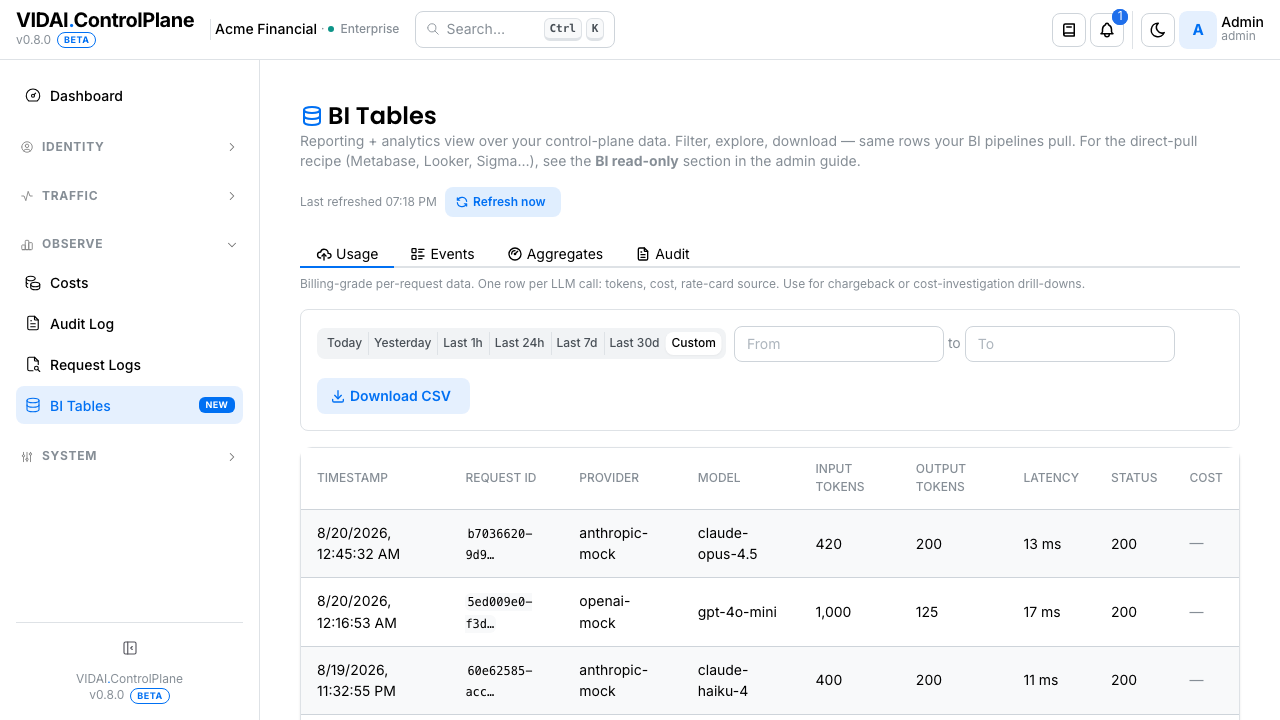
Each tab has the same shape: filters at the top (date range, scope), a paginated preview table, and a Download CSV button. The CSV respects the active filters.
What you do on this page
Finance chargeback: per-key cost for last month
Goal: a CSV listing every API key with its cost for the previous calendar month, ready to paste into the finance billing system.
- Usage tab.
- Date range → last month.
- Scope →
key. - Metric →
cost_usd. - The preview shows the breakdown.
- Download CSV.
The CSV columns: time_bucket, key_id, key_name,
owner_email, owner_user_id, cost_usd,
request_count. Easy paste into finance.
Incident triage: 403 spike at 14:00 UTC
Goal: extract every 403 event from a 30-minute window for an incident review.
- Events tab.
- Time range → 14:00–14:30 UTC on the affected date.
- Status code →
403. - Preview shows the matching events.
- Download CSV.
The CSV columns: every field from the request-log row plus the upstream-attribution fields (provider, model, key hash, key owner). Hand to whoever's running the incident review.
Compliance evidence: who changed admin config in Q1
Goal: a quarterly audit needs a CSV of every admin action in Q1.
- Audit tab.
- Date range → calendar quarter.
- Action filter → leave blank for everything, or narrow to specific verbs if scope is bounded.
- Download CSV.
The CSV columns: time, actor_id, actor_email,
action, resource_type, resource_id, before, after.
Includes the structured before/after diff for every edit.
Schema-stable extract for a nightly pipeline
Goal: BI team wants to set up a nightly cron that pulls the previous day's events into Snowflake.
The pattern: their script hits the same endpoint the Events tab's Download CSV uses, with parameters that narrow to one day. The endpoint is paginated; the script walks pages until exhausted.
For very large extracts, the Aggregates tab is faster: it's pre-computed instead of re-aggregating per request.
💡 Pro tip. The BI projections are designed to be schema-stable across releases. Adding columns is OK; renaming or removing existing columns isn't. Your nightly script can rely on the column names you've set up against today.
Pull cost data for a specific provider
Goal: how much did we spend on each Anthropic model last month?
- Usage tab.
- Date range → last month.
- Scope →
model. - Provider filter →
anthropic. - Download CSV or read the preview.
The same data shows up on Cost Engine → Cost Slicing, but the BI Tables CSV is the right shape if you're pasting into another tool.
Reference
Permissions
| Role | Sees BI Tables | Can do |
|---|---|---|
| admin | Yes | Full read access. CSV export. |
| bi_read_only | Yes | Same read access as admin on this page. Cannot edit anything anywhere. Designed for BI service-account access. |
| user | No | Page hidden. |
Tab projections
| Tab | Granularity | Columns (selected) |
|---|---|---|
| Usage | Per (time-bucket × scope-value) row | time_bucket, scope_kind, scope_value, request_count, total_tokens, cost_usd |
| Events | Per-request | request_id, time, key_hash, key_name, owner_email, owner_user_id, owner_subject_kind, model_requested, model_actual, provider, status_code, latency_ms, log_reason, guardrail_status, guardrail_rule_id, guardrail_category, routing_rule_id, fallback_triggered, fallback_from_provider, fallback_original_model, cost_usd |
| Aggregates | Per (scope_kind × scope_value × metric) | scope_kind, scope_value, metric, value, computed_at |
| Audit | Per admin-action | time, actor_id, actor_email, action, resource_type, resource_id, before_json, after_json |
Filters per tab
| Tab | Filters |
|---|---|
| Usage | Date range, scope kind (key/user/group/model/provider/global), per-scope value picker, metric (cost_usd / request_count / total_tokens) |
| Events | Date range, status code, key hash, model, provider, guardrail status, routing rule id, log reason |
| Aggregates | Scope kind + value, metric, window size |
| Audit | Date range, actor, action, resource type, resource id |
CSV format
- UTF-8 encoding.
- RFC 4180 quoting (commas in values are quoted; quotes are double-quoted).
- First row is column headers.
- Time fields are ISO-8601 UTC.
- Cost fields are decimal USD strings (e.g.
0.0123). - JSON fields (audit before/after) are quoted JSON strings.
Aggregates tab: special note
Aggregates are computed by a background worker that runs periodically. The computed_at column tells you how fresh each row is. If you need real-time aggregation, the Events tab is the source of truth (you re-aggregate from raw events).
The Aggregates tab shows the worker's status at the top: running / stopped, and the time of its last write. If the worker is off, the table is empty by design. Toggle it on under Settings → Tenant administration → Background workers (admin only). The worker is off by default on fresh deployments.
Limitations
- Page-size cap. Each pagination page is capped at ~10000 rows by default; larger pulls require multi-page walks. Most BI pipelines handle this naturally.
- No real-time push. This page is poll/pull only. Real-time event streaming to a Kafka / Kinesis topic isn't supported today.
- Aggregates window granularity. Aggregates are computed over fixed window sizes (typically 1h, 24h, 7d). Custom windows (e.g. "last business hour") aren't supported: re-aggregate from Events for those.
- Fallback fields reliability across export paths.
Fallback-related columns (
fallback_triggered,fallback_from_provider,fallback_original_model) are populated correctly on the Events tab CSV. On certain deployments where BI pipelines pull from the underlying telemetry export directly (rather than through this page), the same fields can show NULL due to a known issue in the export adapter. If you see this, use the in-console Events tab CSV (reliable) or contact your VIDAI support contact.
Common questions
The CSV download has fewer rows than the preview showed.
The preview is paginated (typically 50 rows per page); the download exports up to ~10000 rows respecting your filters. If you need more, narrow the time range or use the Aggregates tab.
A column I expected isn't on the CSV.
Compare against the tab projections table above: the CSV mirrors the per-tab shape. If the column is in the table but the CSV doesn't have it, contact support; if it's not in the table, the projection doesn't include it (request a column-add via support).
Why is the Aggregates tab empty?
The aggregate-refresher worker isn't running. It's off by default in some deployments to save cost (it runs
count(*)-shape queries that can be expensive on large tables). Contact your VIDAI support contact to enable.The Events tab is slow on a wide date range.
Querying every event over 30+ days is bandwidth-heavy. Two faster paths: - The Usage tab: pre-aggregated. - The Events tab with tighter filters: filter to one team or one model first.
My BI tool is hitting an authentication error.
BI service accounts use the
bi_read_onlyrole. Confirm the account has that role on Users. The role gates this page + read access to the data; it doesn't grant any mutation capability anywhere else in the console.Some columns are blank for older rows but populated for recent ones.
Schema additions don't backfill historical rows. A column added in a recent control plane version starts being populated from that version's deployment date onward; older rows have it as null. The documentation calls out which fields are recent additions.
Can I subscribe to a webhook when new data is available?
Not on this page. Webhooks covers event-driven integrations (per-event push); BI Tables is for periodic-pull batch.
Where to go next
- Request Logs: interactive, per-call detail. The Events tab CSV is a bulk-export of the same underlying data.
- Audit Log: interactive admin-action history. The Audit tab CSV is the bulk export.
- Cost Engine → Cost Slicing: the same per-(scope, metric) data the Usage tab projects, but interactive.
- Dashboard: the headline numbers; the Aggregates tab projects the same data underneath the panels.
- Webhooks: for event-driven push integrations rather than periodic pulls.