Compliance¶
🔒 Enterprise edition. Compliance routing, per-rule attribution, and the Compliance Insights panel are part of the Enterprise tier. On Community, the routing wizards don't surface the Compliance step, the All Rules tab hides the Compliance filter, and the Compliance Insights panel on the dashboard shows a locked card instead. Compliance-tagged data from a previous Enterprise period stays visible read-only; the control plane keeps applying the tags at request time. See Licensing & tiers § Downgrade behaviour.
📖 New here? Read the story first. This page is the screen-level mechanics. For why compliance works the way it does (the obligation model, enforce-and-prove, and how ISO/IEC 42001 fits), start with Compliance & governance, the leading-story front-door. This page is what you open once you know the arc and need the detail.
Compliance is the page-less feature: there's no Compliance entry in the sidebar, but a Compliance Insights panel sits on the Dashboard, and every routing rule's create form has a Mark this rule as compliance checkbox.
This page is the guide to tagging rules, reading each panel block, and the reference + common questions. The narrative (obligations, why % not a checkbox, the ISO proof half) lives on Compliance & governance.
When you'd open this surface¶
- An auditor asks "what compliance enforcement did the VIDAI Control Plane do this quarter?". Open the dashboard and read the Compliance Insights panel.
- You're authoring a routing rule that exists for a policy reason. Tag it compliance at create time.
- You need to show that the control plane is producing the operational evidence an ISO/IEC 42001 assessor expects. Read the ISO/IEC 42001 audit evidence section.
- You want to know whether your automated / agent traffic is enforced as well as your human traffic.
- You're filtering the Routing rules list to "just the compliance-tagged rules" for a review.
The compliance label¶
A compliance label on a rule tells the control plane the rule exists for an organisational policy reason. It's separate from the rule's mechanism: a single rule can be both a cost-saver AND a compliance rule; it contributes to its mechanism story and counts as compliance enforcement. The numbers don't double-count (each view answers its own question; see Compliance & governance for the why).
The five reasons¶
When you tag a rule, you pick one or more reasons:
| Reason | When to pick it |
|---|---|
| Regulatory | Laws or regulations require this routing: GDPR, HIPAA, SOX, FedRAMP. |
| Sovereignty | Data residency: "this data must stay in this region." |
| SLA | Contractual: a customer pays for a specific model or provider. |
| Customer-hosted | The target model runs on the customer's infrastructure. |
| Other | Anything policy-driven that doesn't fit the four: note the actual reason in the rule's description. |
Multiple reasons are allowed: a single rule can be both regulatory AND sovereignty.
Enforcement that counts automatically¶
Some things count as compliance enforcement without any admin tagging:
- Guardrail block: every guardrail-blocked request.
- Guardrail mask: every masked request (the control plane kept sensitive content from reaching the upstream).
- Access-control deny: every request a deny rule rejected because the caller wasn't permitted.
The dashboard counts these automatically. You don't tag the underlying guardrail or deny rule.
⚠️ Watch out. A guardrail set to log only observes but doesn't act, so it is not enforcement and is not counted as compliance protection. If you want it to count, change its action to
maskorblockon Guardrails.
How to tag a rule as compliance¶
The compliance label lives on the Compliance step of every rule-create wizard (Routing: Redirect, A/B Test, Deny, Spend Circuit, Custom intents).
- Open the Routing page.
- Add a new rule (any intent) or edit an existing one.
- On the Compliance step, find Mark this rule as compliance.
- Tick the box (or leave it ticked: see "Defaults" below).
- Pick at least one reason from the multi-select.
- Save / continue.
Defaults¶
| Intent | Default state | Why |
|---|---|---|
| Cost Saver / Vendor Switch / A/B Test / Spend Circuit / Custom | Unticked | Most rules of these intents are operational, not policy-driven. |
| Access Control (Deny) | Pre-ticked | Deny rules almost always exist for a policy reason. Untick if the rule is engineering-shed (e.g. load-shedding, redirecting a noisy team to a smaller model). |
The pre-tick on Access Control is a default, not a constraint; your intent overrides it. If the box is unticked, the rule won't count as compliance enforcement even though it's an access-control rule.
Editing the label later¶
Open the rule on the Routing page, click the pencil icon, find the Compliance section. Toggling the label or changing reasons takes effect immediately; the dashboard recomputes on the next refresh.
What you see on the dashboard¶
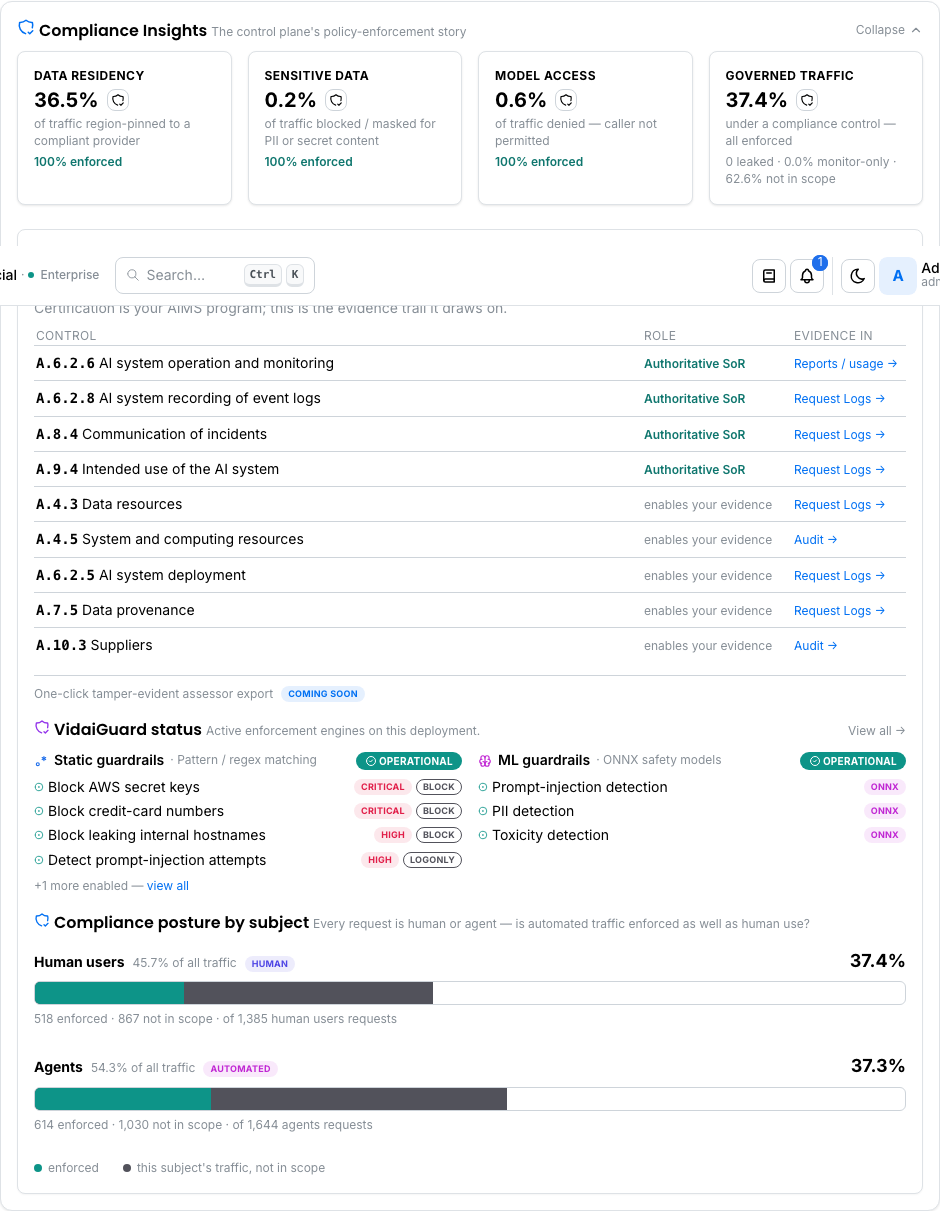
The Compliance Insights panel sits below the Cost Insights panel. It is built around four reads, in the order a compliance officer thinks about them:
- By obligation: the headline row. Of all your traffic, what share is residency-controlled, sensitive-data protected, and model-access controlled?
- ISO/IEC 42001 audit evidence: is the operational evidence an AI-governance assessor expects being recorded and stored?
- VidaiGuard status: are the enforcement engines (static regex + ML) actually on?
- Compliance posture by subject: is automated / agent traffic enforced as well as human traffic?
The window selector at the top of the dashboard applies to the panel: switch between last 7 / 30 / 90 days or a quarter.
The obligation rail (the headline)¶
A compliance officer doesn't think in mechanism names. They think in obligations. The rail translates the control plane's enforcement into the three obligations it can speak to, each as a percentage of your traffic: the percentage is the headline; the raw request count is supporting detail.
| Card | What it answers |
|---|---|
| Data residency | % of traffic region-pinned to a compliant provider (compliance-tagged routing that switched vendor/region). |
| Sensitive data | % of traffic blocked or masked for PII or secret content (guardrail block / mask). |
| Model access | % of traffic denied because the caller wasn't permitted (deny / access-control). |
| Governed traffic | % of traffic under any compliance control this window, with the remainder accounted for: how much was monitor-only and how much simply had no compliance control apply. |
Each obligation card's footer reads 100% enforced when that
obligation produced any controlled traffic this window (the
control plane acts on these, it doesn't merely observe them), or
none this window when it didn't fire. The Governed
traffic card spells out the whole picture (0 leaked ·
X% monitor-only · Y% not in scope) so "where's the rest of
the traffic?" is answered inline: it's traffic no compliance
control applies to, not missing data.
If coverage data isn't available for the selected window, the rail collapses to a single Compliance state card with "Coverage data unavailable for this window."
📌 Worth knowing. % is deliberately the headline, not a raw count. "1,217 requests enforced" means nothing without a denominator; "39% of traffic under a compliance control" is the number an auditor can actually reason about.
ISO/IEC 42001 audit evidence¶
Below the rail, the ISO/IEC 42001: audit evidence block shows, per evidenced control, what role the control plane plays and where the evidence lives. It carries an Operational badge when request and audit logs are being recorded.
This block is significant enough (and distinct enough from the rest of the panel) that it has its own page: ISO/IEC 42001 audit evidence. Read that for the control list, the role vocabulary, the honest-scope framing (the control plane provides operational evidence; it does not certify), and how an assessor uses it.
VidaiGuard status¶
VidaiGuard status shows the two enforcement engines on the deployment, each with its own operational state:
- Static guardrails: pattern / regex matching. Badge: Operational (enabled rules present), or Inactive (none enabled).
- ML guardrails: ONNX safety models. Badge: Operational, Inactive (service up, none enabled), or Not deployed (the ML service isn't running on this deployment).
The two states are independent on purpose: a deployment can have static guardrails working perfectly while the ML tier is Not deployed. That gap must read at a glance; it's not hidden behind the static engine looking healthy. Most compliance regimes assume the ML tier is on; Not deployed is a prompt to check.
Each column previews the top enabled rules with their action and severity; View all → goes to Guardrails for tuning. This panel is "is the protection layer on?" at a glance, not the place to configure it.
Compliance posture by subject¶
The last block answers a question auditors increasingly ask: "Is our automated / agent traffic enforced as well as our human traffic?". This is the automated-decisioning assurance.
Every request is either a human user or an agent (or unattributed). The two together are all your traffic; they're not a sample. The block shows a paired bar per subject:
- The bar length is that subject's share of all traffic (Human + Agent add up to the whole; nothing is missing).
- The solid leading portion is the share of that subject's own traffic that's under a compliance control.
- The big number is the enforcement % within that subject; the
line below spells out
N enforced · M not in scope · of T requestsso the remainder is always accounted for.
A casual reader sees it instantly: if both bars are a similar length and have a similar solid lead, agents and humans carry similar volume and similar enforcement, with no automated-traffic blind spot. If the agent bar's solid portion is much shorter, your automated traffic is under-enforced relative to human use.
💡 Pro tip. This is the fastest way to catch "we enforce our chat UI carefully but our agent fleet calls the control plane wide open." A short solid lead on the Agents bar is the signal to tighten agent-scoped rules.
If the deployment is on an older build that doesn't provide the subject split, this block honestly shows Planned: needs data rather than estimating numbers.
Filtering rules by compliance¶
On the Routing All Rules tab, the Compliance only chip filters the list to rules currently carrying a compliance label. Useful for:
- Compliance reviews: "show me every rule that exists for a policy reason."
- Sanity-check before re-tagging: find untagged rules that should be tagged.
Reference¶
Compliance label fields¶
| Field | Type | Effect |
|---|---|---|
| Mark this rule as compliance | Boolean | When ticked, the rule's enforcement counts toward the obligation rail. Default ticked for Access Control, unticked for everything else. |
| Reasons | Multi-select (regulatory, sovereignty, SLA, customer-hosted, other) | At least one required when the box is ticked. Recorded on the rule and in the audit trail. |
What maps to which obligation¶
The rail is a fixed product fact: it maps the control plane's enforcement to the obligation it serves:
| Obligation | Counts |
|---|---|
| Data residency | Compliance-tagged routing that pinned region/vendor. |
| Sensitive data | Guardrail block + guardrail mask. |
| Model access | Deny / access-control rejections. |
What's NOT counted¶
- Routing rules that aren't compliance-tagged: operational only; they show on Cost Insights / their own mechanism story.
- Guardrails set to
log only: observed, not enforced. They are not compliance protection until promoted tomaskorblock. - Guardrails whose action is
passthrough: inspected and explicitly allowed; not enforcement.
Audit log records¶
Compliance-label changes are recorded as part of the routing rule's audit trail: actor, rule id, and the before/after reason set. Audit Log shows these.
Limitations¶
- The control plane does not certify ISO/IEC 42001. It produces the operational evidence an assessor relies on for a specific subset of controls. Certification is your AI-management-system program. See ISO/IEC 42001 audit evidence for the honest-scope detail.
- No tamper-evident assessor export yet. The panel's one-click assessor export is on the roadmap (shown as "Coming soon"). Today, evidence is exported from the underlying surfaces (Request Logs, Audit, Reports), each of which has its own CSV export.
- No time-based coverage-trend chart. The obligation rail is current-window-only. Use the window selector to compare periods manually.
- No per-customer breakdown on multi-tenant deployments where "customers" map to keys/teams. Metrics aggregate at the deployment level.
- ML-tier attribution is by category, not by individual neural model. An assessor asking "what kinds of policy fired?" gets the right answer; "which specific ML model decided?" needs a future release.
Common questions¶
The obligation rail says 39% governed traffic. Where's the other 61%?
It's traffic that no compliance control applies to: ordinary requests that aren't residency-pinned, don't trip a guardrail, and aren't denied. The Governed traffic card spells this out:
0 leaked · X% monitor-only · Y% not in scope. "Not in scope" isn't a failure; it's traffic outside any policy you've configured. A higher number isn't automatically better; it depends on how much of your traffic should be under a control.A request triggered both a guardrail mask and a compliance-tagged routing rule. Was it double-counted?
No. The obligation percentages are computed over distinct requests for the window; a request under two mechanisms is still one governed request. The percentages are honest denominators, not summed mechanism counts.
My team uses guardrail
log onlyto "track" PII events. Why doesn't it show as enforced?Because
log onlyobserves; it doesn't act. The control plane saw the PII but didn't block or mask it, so it isn't compliance enforcement. To make it count, change the action tomask(request continues, PII redacted) orblock(request rejected) on Guardrails.The Agents bar is much shorter than the Human bar. Is that bad?
It means agent traffic is enforced at a lower rate than human traffic: a potential automated-decisioning blind spot. Check whether your compliance-tagged rules and guardrails are scoped to cover agent/application principals, not just human users. Routing rule scope and Guardrails group composition are where you tighten this.
VidaiGuard shows ML guardrails "Not deployed." Is the panel broken?
No: that's the panel doing its job. It means the ML safety service isn't running on this deployment. Static guardrails still work, but ML detection (injection, PII, toxicity, IP) is off. Most compliance regimes expect ML on; treat it as a prompt to check the deployment, not a display bug.
A rule is tagged compliance but doesn't show on the panel.
Two usual suspects: (1) the selected window has no traffic that hit the rule (switch to a longer window: a quarter usually surfaces enough); (2) the rule is disabled (disabled rules don't fire; enable on Routing).
Why is Access Control pre-ticked as compliance?
"This team isn't allowed to call this model" is, by definition, policy. The pre-tick reflects the typical case. Untick when the deny exists for a non-policy reason (engineering load-shedding, noise reduction).
Where do I see who tagged a rule as compliance?
Audit Log → filter by
action = rule.update. The before/after shows the compliance-label change with actor and timestamp.Can I write a rule that's only compliance, with no mechanism?
No. Every rule has a mechanism (cost-saver, vendor-switch, A/B, deny, spend-circuit, custom). The compliance label is additive on top. For "content matching X goes to a safer model," use a guardrail with action
redirect, not a compliance-tagged routing rule.
Where to go next¶
- ISO/IEC 42001 audit evidence: the audit-evidence block in depth: control list, role vocabulary, honest scope.
- Routing: rule tagging happens on the Compliance step of every rule wizard.
- Guardrails: every guardrail block / mask / redirect counts as compliance enforcement automatically; tune the static and ML tiers here.
- Dashboard → Compliance Insights: the rolled-up view in the context of the whole dashboard.
- Request Logs: every individual enforcement event, with CSV export for evidence packs.
- Audit Log: every compliance-label change, and the routing/provider configuration trail an assessor relies on.