Console navigation¶
This is the orientation page. It tells you what's in the sidebar, what's in the header, and which surface to open for the most common things admins do. Most of these affordances also work from the keyboard; see Search ⌘K for the fastest path to anywhere.
If you've used the console before and just want the sidebar mental model: it's grouped four ways (Identity, Traffic, Observe, and System). The grouping is by what you're trying to do, not by where the data lives. Skip ahead to The sidebar.
If you're brand new, Getting started walks you through the first 30 minutes and links back here.
The header¶

Left to right:
- VIDAI.Server brand + version: clicking the brand takes you to the Dashboard. The version line below is the build the console is running against.
- Search ⌘K pill: opens the command palette. See Search ⌘K.
- Deployment chip: shows your customer ID and licence tier. The dot next to the tier is a licence-health cue with four colours; see The deployment chip dot below.
- Recompute-costs pill (appears only when needed): see The recompute-costs pill.
- Docs icon (book): opens the documentation site in a new
tab. Embedded deployments point at the locally-served docs;
external deployments point at
docs.vidai.uk. - Notification bell: see The notification bell.
- Theme toggle: light / dark, persisted in your browser.
- User menu: your avatar + name + role. Opens a dropdown with Settings and Log out.
The deployment chip dot¶
The small dot next to the tier label in the deployment chip encodes the licence's health at a glance. Four states, ranked by precedence:
| Dot | Hover tooltip | Meaning |
|---|---|---|
| 🔴 Red | "Recovery mode: install a licence to restore full features" | No working licence (env missing or unrecoverable corrupt). Eval caps active. |
| 🟡 Yellow | "Running on cached licence: env key invalid, will revert at next restart unless fixed" | The env JWT is corrupt but the cache fallback is alive. Fix VIDAI_LICENSE_KEY before the next restart. |
| 🔴 Red | "Development licence: don't ship from this build" | Enterprise licence with a dev/test customer ID (cust_dev*, cust_local*, cust_test*). Working licence, just not a production one. |
| 🟢 Green | "Live licence: healthy" | Everything's fine. |
The full state walk-through (including which banner fires on the License page under each state) lives on Licensing & tiers § The five banner states.
Nav items with Enterprise pills¶
Some sidebar entries carry an Enterprise pill on Community deployments: Webhooks and BI Tables today. The pages are still reachable, but instead of the live surface you land on a "this page is part of Enterprise edition" card. Same sidebar layout regardless of tier; only the page contents change. See Licensing & tiers for the full list of Enterprise-only surfaces.
Search ⌘K (the command palette)¶
The fastest way to navigate the console is a spotlight overlay that opens on top of any page.
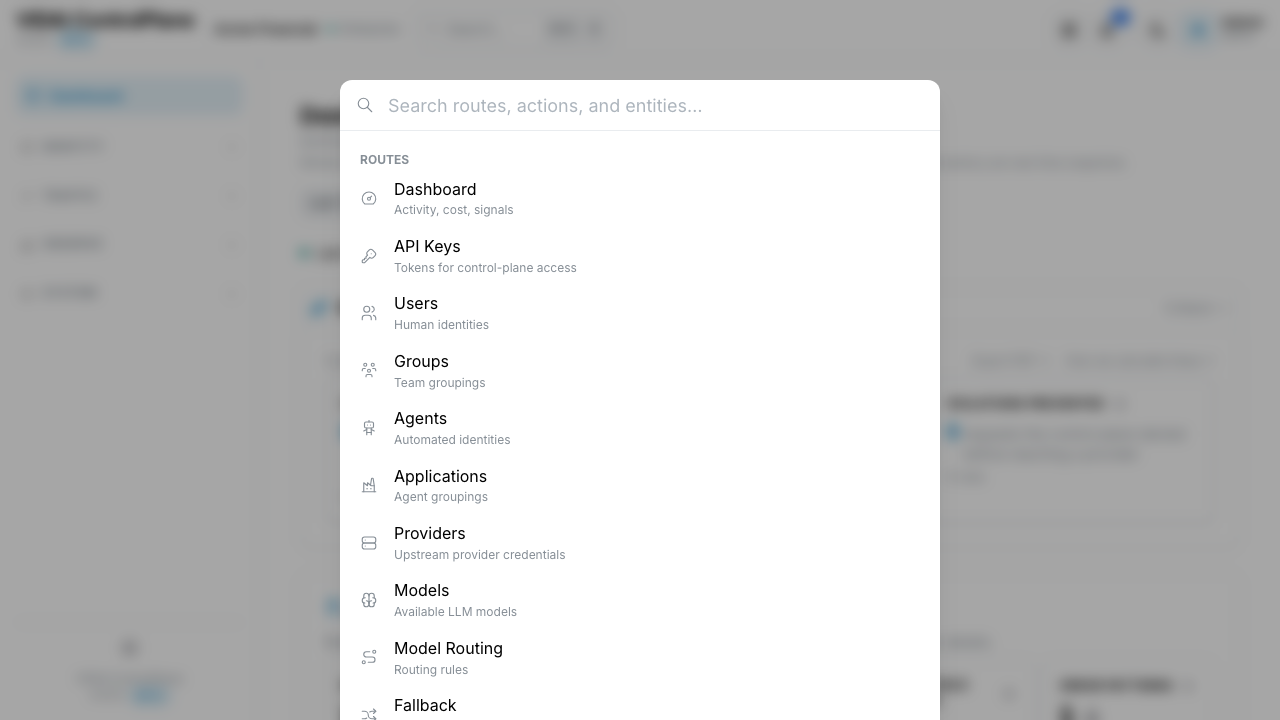
How to open:
- Click the Search… pill in the header, or
- Press ⌘+K on a Mac, or
- Press Ctrl+K elsewhere.
What it accepts:
| You type… | …and get |
|---|---|
| Nothing | A short Recent list of your last few destinations, plus the full sidebar of pages so you can keyboard-jump to any of them. |
A page name (routing, cost, keys) |
The matching page. Enter opens it. |
| A rule, agent, application, key, model, group, webhook, or user name (or fragment) | The matching entity, grouped by type. Enter opens the right page focused on that entity. |
A free-text action (add key, add rule, change theme, log out) |
The corresponding admin action. Enter runs it. |
The palette respects role gating: non-admins see only what
their role can navigate to or perform. So for an admin "agents"
returns the Agents page; for a bi_read_only user, "agents"
returns nothing.
💡 Pro tip. The palette is the only fast way to jump directly to a specific entity by name. The "Applications → list → search" tap-trail is fine when you're browsing, but if you remember the name and you've got a keyboard, ⌘K beats it.
📌 Worth knowing. Recent items live in your browser. Clearing browser data resets the recents list; it doesn't affect anyone else.
The sidebar¶
The sidebar groups pages by what you're trying to do. Dashboard sits above the groups as the always-visible "home." Below it, four collapsible sections:
| Section | What lives there | Open this when… |
|---|---|---|
| Identity | API Keys, Users, Groups, Agents, Applications | Someone needs access. Someone shouldn't have access anymore. You're answering "who is this?" |
| Traffic | Providers, Models, Routing, Fallback, Rate Limits, Guardrails | You're shaping what calls the control plane accepts and where they go. |
| Observe | Costs, Audit Log, Request Logs, BI Tables | Something happened, or something didn't, and you need to know what. |
| System | Webhooks, License, Settings | The control plane itself: its outbound integrations, your license, your own profile. |
The section that contains the page you're on is open at first paint. Other sections are closed at rest. Clicking a section header toggles it; clicking a page jumps you there. If you open two sections, navigating between them doesn't auto-collapse; the console respects the layout you set up.
You can also collapse the entire sidebar to a narrow icon strip via the chevron at the bottom of the sidebar, which is useful when you want more horizontal room for wide tables (Request Logs, BI Tables, the Routing rule list). The collapsed sidebar still shows section icons, so you can hover or click to navigate. Collapse state persists per browser.
💡 Pro tip. Keep the sidebar collapsed and use ⌘K for navigation. The sidebar is a fallback for when you're browsing; the palette is faster for any specific destination.
What you see depends on your role¶
Some sidebar items are gated:
| Role | What they see |
|---|---|
| Admin | Everything. Every section, every page. |
| BI read-only | Dashboard + BI Tables + Settings. The Identity / Traffic / System sections are hidden. |
| User | Dashboard + API Keys (their own only) + Settings. |
📌 Worth knowing. If a page is missing from your sidebar, that's role gating, not a bug. Ask your admin to upgrade your role if you genuinely need the page; the gating is consistent across the API and the console, so there's no "use this URL directly" workaround.
Badges next to page names¶
A few items wear a small New badge. Today those are:
- Agents + Applications: the agentic identity model. Admins managing automated callers (bots, batch jobs, integrations) work here.
- BI Tables: the data-access surface for external BI
stacks. CSV export per tab; gated to admin and the
bi_read_onlyrole. - Webhooks: push-based event deliveries with HMAC signing. Off by default in fresh installs; see Webhooks for the deployment-side egress note.
The badge fades after the feature has shipped a few releases. If you don't see a badge on something the release notes called new, the team has retired the badge; the feature isn't gone.
The notification bell¶
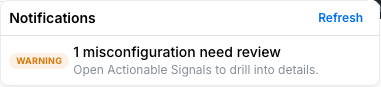
The bell aggregates "things you should look at" from across the console. The badge on the bell shows the unread count (capped at 9+); it turns red when there's at least one critical item.
What lands here today:
| Source | Severity | What it tells you |
|---|---|---|
| License expiry | warning when ≤ 30 days, critical when ≤ 7 days, also critical when expired | Your license is about to lapse or has lapsed. Action lives on the License page. |
| Misconfigurations | warning or info per finding | Routing rules that never fire, source models without rate cards, agents without API keys, etc. Each one click-throughs to the right page (a routing rule lands you on Routing; an agent without keys lands you on Agents). |
| Showcase exclusions | info | Routing rules excluded from the VIDAI Impact totals on the dashboard. Click-through to the dashboard to review. |
Each row carries a severity badge (info / warning / critical), a one-line summary, the affected subject, and a dismiss ✕. Clicking anywhere else on the row takes you to the right page to fix it.
Dismissing¶
Dismissing a notification removes it from your bell. The dismiss is per-browser, per-user. Clearing browser data resurfaces dismissed items. If the underlying issue resolves (you fix the misconfig, you bump the license), the next refresh prunes the dismissed entry; the same issue re-appearing later re-surfaces it.
💡 Pro tip. The bell auto-refreshes every 5 minutes. The Refresh button in the popover header pulls fresh data on demand. Don't reload the whole page just for the bell.
⚠️ Watch out. The dismiss state lives in your browser, not on the control plane. If you dismiss a critical license-expiry warning on your laptop, your colleague will still see it on theirs. That's by design (different admins watch different things), but keep it in mind if you're triaging together.
📌 Worth knowing. The popover is capped at a scrollable ~6-row window so it never overflows the viewport. If you have many notifications, scroll inside the popover, not the page.
The recompute-costs pill¶
A small Recompute costs pill that appears in the header only when something has changed that may have left your historical chargeback out of step with your current rate cards.
When does it appear?
- After a rate-card sync produces deltas (a vendor's prices moved, the control plane's catalogue picked up the change).
- After someone edits a manual rate-card override.
What does it do?
- Click it and you land on Cost Healing (Cost Engine) with the affected window pre-filled. You preview the impact of recomputing your ledger against the new rates, then commit if the delta looks right.
The pill clears the moment you commit a recompute that covers the change. There's no dismiss button; the action itself is the acknowledgement. If a later change happens (another sync, another override), the pill comes back.
📌 Worth knowing. The pill is informational, not alarming. Past chargeback rows aren't wrong (they recorded what was actually charged at the time); the pill is asking "do you want them rewritten now that rates have moved?" If you don't, ignore it; if you do, click through. Either is correct depending on your finance practice.
Where common actions live¶
If you know what you want to do but you're not sure which page does it, either type it into ⌘K or use this table:
| Doing this… | …go here |
|---|---|
| Mint a new API key for a user | API Keys → Create Key |
| Mint a key on behalf of a user (admin) | API Keys → scope switch → Create Key with Owner picker |
| Disable a user's keys quickly | Users → user row → Disable (cascades to all their keys) |
Make gpt-4o quietly route to gpt-4o-mini for dev traffic |
Routing → Add Rule → Redirect tab |
| Run an A/B test between two models | Routing → Add A/B Test |
| Block a model for a specific team | Routing → Add Deny Rule + scope to team |
| Cap monthly spend on a model | Routing → Add Spend Circuit |
| Plan a fallback for a flaky upstream | Fallback → Add Chain |
| Investigate a specific request | Request Logs → search by request id or key |
| Investigate cost spikes | Costs → top-N by user / key / group |
| Recompute historical chargeback after a price change | Cost Engine → Cost Healing |
| Find who changed a config | Audit Log → filter by action + actor |
| Add a new upstream provider | Providers → Add Provider (per-preset details: provider catalogue) |
| Register a new model | Models → Add Static Model |
| Set a per-key rate limit | Rate Limits → Set Limit for the key |
| Create a guardrail that masks PII | Guardrails → Add Rule with action mask |
| Pull a chargeback CSV for finance | BI Tables → Aggregates or Usage tab → Download CSV |
| Subscribe an external system to control plane events | Webhooks → Add Destination |
| Change your password | Settings → Change Password |
| Switch between light and dark theme | ⌘K → "theme" → Enter, or the theme toggle in the header |
Common questions¶
Why is the sidebar collapsed every time I land on a page?
Only sections that don't contain the active page are collapsed. The section owning your current page is auto-open at first paint so you can see siblings without an extra click. (You can also collapse the whole sidebar to icons via the chevron at the bottom; that state persists.)
The "Add Rule" button on Routing is greyed out for me.
You're logged in as a non-admin role. Routing edits are admin-only. The page is visible in read-only form for auditors / BI users; the create / edit affordances are hidden.
Why does my colleague see Webhooks in their sidebar but I don't?
Webhooks is admin-gated. Your colleague is an admin; you probably aren't. The role lives on your user row; see Users → role.
The deployment chip's dot is red. Did something break?
Maybe. Hover the dot; the tooltip tells you which of the four states you're in (see The deployment chip dot above). The two red states are:
- Recovery mode: no working licence. The deployment is still running but with eval caps (25 keys / 5 users). Install a licence + restart.
- Development licence: Enterprise licence, but the customer ID matches a dev/test pattern. Working licence, not a production deployment.
Yellow means cache mode: the env key is corrupt but the cache fallback is alive. Fix
VIDAI_LICENSE_KEYbefore the next restart. Green is healthy.The bell shows a lot of misconfigurations after I first set things up. Is that normal?
The first day or two of a new control plane often has a handful of warnings: rules created during setup that haven't fired yet, models without rate cards, agents still being wired up. Most resolve naturally as the setup completes; the bell prunes them on the next refresh. If a warning lingers more than a few days, click through to the page it points to and address it there.
Is there a keyboard shortcut for everything?
Most pages and actions are reachable via the ⌘K palette (⌘K on Mac, Ctrl K elsewhere). Type, Enter; that's the only universal shortcut. Page-specific shortcuts (like column filters on Request Logs) live on those pages.
Where to go next¶
- Getting started: the first 30 minutes if you haven't done that walkthrough yet.
- Dashboard: the at-a-glance landing page every section eventually links back to.
- API Keys: the most-visited Identity page; also the voice template for the rest of the guide.
- Client integrations: when your applications, agents, or LLM frameworks need to call the control plane (which base URL, which SDK, which framework is known to work).