Getting started
This is the first thirty minutes. By the end you'll have logged in, found your way around, minted your first API key, and made your first call through the VIDAI Control Plane. Nothing here is reversible or risky, so feel free to click around as you read.
If you've been here before and just want the lay of the land, Console navigation is the orientation page. This one is for first-timers.
If the VIDAI Control Plane isn't running on a host yet, start at Install VIDAI Server. It covers the deployment models and the self-service Docker quickstart. Come back here once you can reach the dashboard URL.
Before you start
You need three things from whoever set up your control plane deployment:
- A URL for the admin console (something like
https://vidai.your-company.example). The console is served from the same hostname as the control plane itself. - A username and password for your admin account. If you're the very first admin in a fresh install, the team that installed the control plane will have given you a one-time password and asked you to change it on first sign-in.
- Your role. Most readers of this guide are signed in as admin, which sees everything. If you're signed in as BI read-only or as a regular user, parts of the console are hidden from you on purpose. That's role gating, not a bug.
📌 Worth knowing. You don't need any provider keys (OpenAI, Anthropic, Google, etc.) to log in. Provider credentials live on the Providers page and are managed centrally; users and applications just need their VIDAI key.
Step 1: Sign in
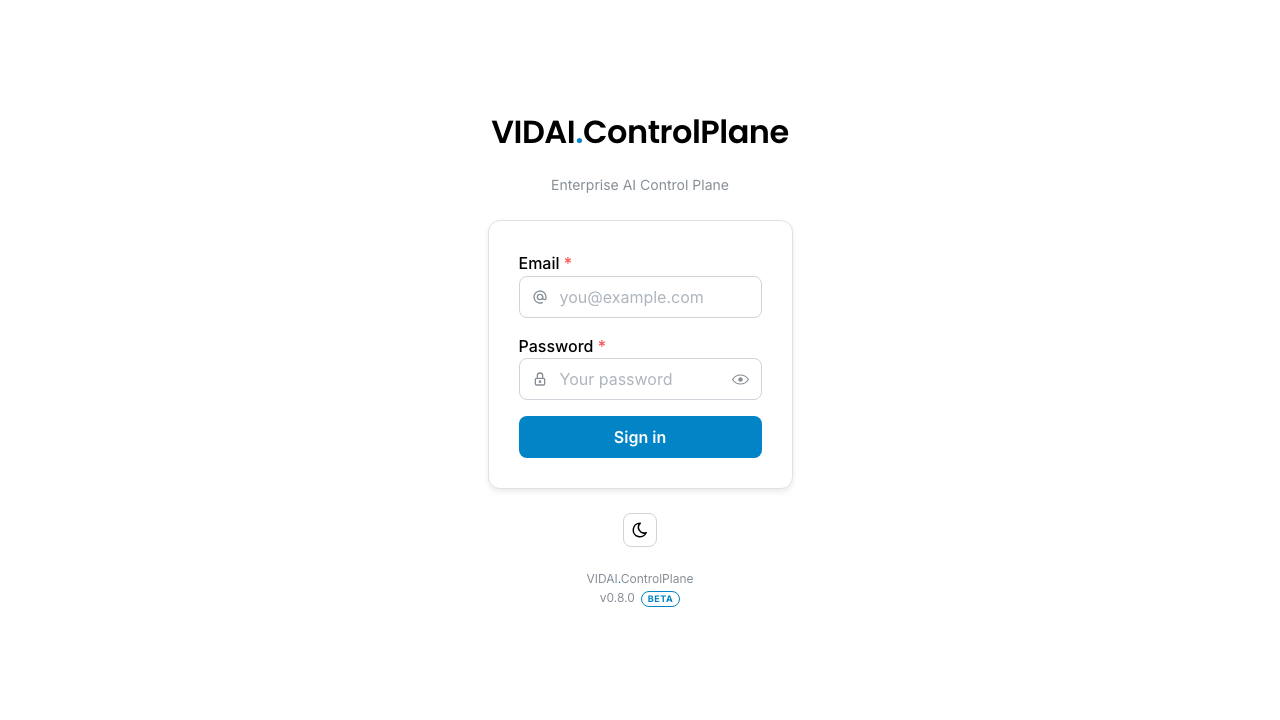
The sign-in form takes an email and a password. Enter what you were given and click Sign in.
First-time sign-in
If you're signing in for the first time on a freshly-installed deployment, the control plane will require you to change the temporary password the platform team set for you. Pick something you can remember; you'll use it every time you come back.
⚠️ Watch out. If your deployment has SSO configured, the sign-in screen redirects you to your identity provider instead of asking for a password. The rest of this guide works the same way once you're signed in.
If you forget your password later, ask the platform team to reset it. There's no "forgot password" email flow today (the control plane is typically deployed inside an organisation that has its own password-reset process).
Step 2: Land on the dashboard
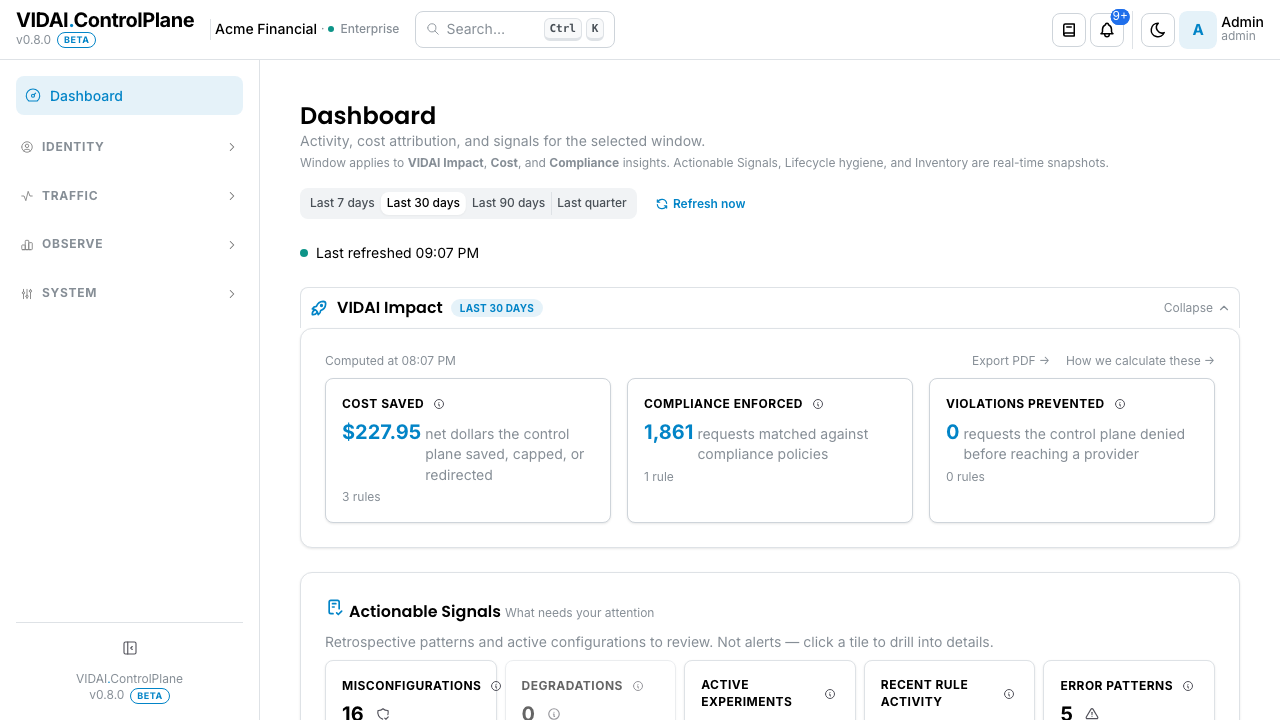
The first thing you see is the Dashboard. It's the home for every section in the sidebar. On a fresh deployment with no traffic yet, the panels show zeros and "all clean" states. That's expected. The panels fill out as soon as your first applications start hitting the control plane.
What you're looking at, top to bottom:
- VIDAI Impact: the three headline numbers, namely Cost Saved, Compliance enforced, and Violations prevented. (Other impact types, such as migrations, A/B splits, and outage absorptions, are in the Export PDF.) Each tile is clickable to drill into the contributing rules.
- Cost Insights: total spend over your selected window, daily burn rate, total tokens, average cost per request.
- Compliance Insights: how your routing rules and guardrails compose into an enforced compliance posture.
- Lifecycle hygiene: five tiles surfacing config gaps, namely agents without keys, deprecated agents still active, empty applications, unaffiliated agents, and global-pool keys. Zero on every tile means a clean deployment.
- Actionable Signals: misconfigurations, degradations, active experiments, rule fires, error patterns, policy activity. Each tile click-throughs to a filtered list of the contributing items.
- Inventory: counts of users, agents, teams, applications, API keys, models. Quick-glance numbers for scale.
💡 Pro tip. The time window selector at the top (Last 7 days / Last 30 days / Last 90 days / Last quarter) applies to every panel below it. Refresh the page or click Refresh now to pull fresh numbers.
The header is the same on every page:
- The VIDAI.Server brand on the left clicks back to this dashboard.
- A deployment chip next to the brand shows your customer name and license tier with a small dot: green for production-shaped deployments, red for ones that match a known dev / test name. Useful when you have several environments open in different tabs.
- The Search ⌘K pill opens a spotlight overlay that searches every page, every entity (rules, agents, keys, apps, models, groups, webhooks, users), and a few actions (toggle theme, sign out). The fastest way to navigate once you know what you're looking for. Press ⌘+K on a Mac, Ctrl+K elsewhere; it works from anywhere in the console.
- A Recompute costs pill appears here only when something has changed that may have left your historical chargeback out of step (a vendor's prices moved, a manual rate-card override edited). Clicking the pill walks you into Cost Healing pre-filled with the affected window. You can ignore it if you don't want to refresh history.
- The bell icon shows things you should look at: license expiring, configuration that needs attention. A non-zero count is fine on first install (fresh seed = lots of in-progress configurations); it thins out within a week or two of real use.
- The theme toggle flips light/dark, persisted in your browser.
- The avatar menu opens Settings (your profile) and Log out.
Console navigation covers the bell, the spotlight palette, the deployment chip, and the sidebar in more detail.
Step 3: Find your way around the sidebar
The sidebar groups pages four ways:
| Section | What lives there | When you'd open it |
|---|---|---|
| Identity | API Keys, Users, Groups, Agents, Applications | Someone needs access (or shouldn't anymore). |
| Traffic | Providers, Models, Routing, Fallback, Rate Limits, Guardrails | You're shaping which calls the control plane accepts and where they go. |
| Observe | Costs, Audit Log, Request Logs, BI Tables | Something happened (or didn't), and you need to know what. |
| System | Webhooks, License, Settings | The control plane itself: outbound integrations, your license, your own profile. |
The section containing your current page is open at first paint; others are collapsed. Click a section header to expand it; click a page to jump there. If you open multiple sections, navigating between them doesn't auto-collapse. The console respects the layout you set up.
📌 Worth knowing. The sidebar's Dashboard entry sits above the four sections as the always-visible "home" anchor. Click it any time to come back to the at-a-glance view.
Step 4: Mint your first API key
This is the action that takes you from "logged in" to "actually using the control plane." We'll mint a key for ourselves to test with, then make a call through it.
4a. Open the API Keys page
In the sidebar, expand Identity and click API Keys.
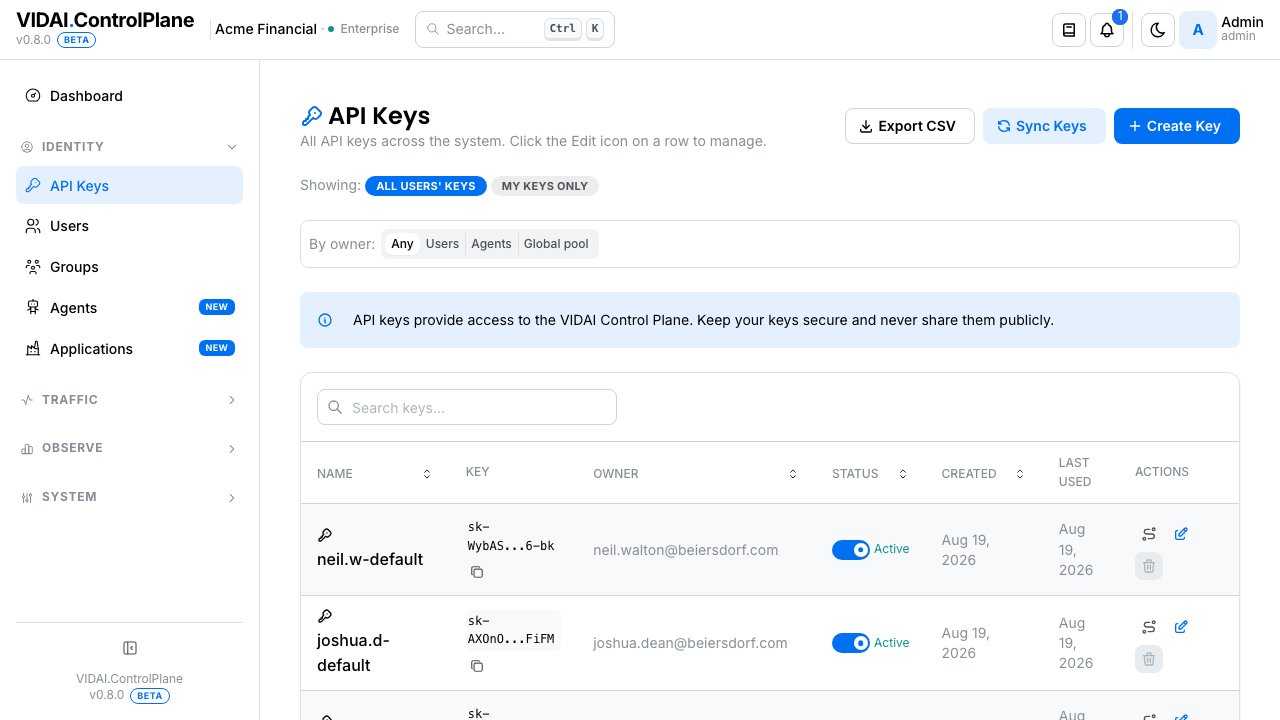
If you're an admin, you'll see a scope switch at the top: All users' keys vs My keys only. For this walkthrough stay on My keys only so we mint a key for ourselves.
Regular users always see only their own keys; the scope switch is admin-only.
4b. Click "Create Key"
The Create-Key dialog opens. Fill in:
- Name: something memorable. "First test key" works fine for now; you can rename later.
- Allowed models: leave as "all" for the walkthrough. Once you have multiple models registered, scoping a key to a subset is how you stop a dev key from hitting expensive production-only models. See API Keys → allowed models.
If you're an admin minting on behalf of a user, you'll also see an Owner picker. Leave it on yourself for now.
Click Create.
4c. Copy the key, once
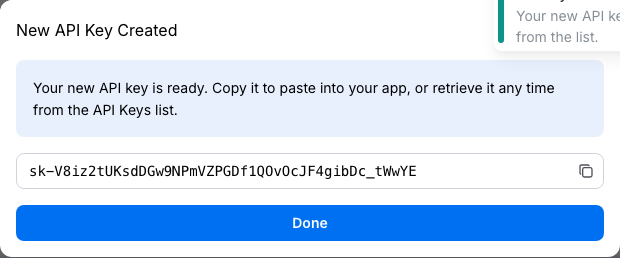
The freshly-minted key is shown to you exactly once. Copy it now and store it somewhere safe (a password manager, your terminal's environment variables, your CI's secret store). After you close this dialog the key is no longer visible anywhere; only its hash is shown on the list.
⚠️ Watch out. There is no "show me the key again" recovery path. If you lose the key before storing it, mint a new one and delete the lost one. The console won't reveal a key after the create-modal closes.
The key looks like an opaque string (e.g.
vidai-abcd1234...). Treat it the same way you'd treat
any production secret: never commit it to a public repo,
never paste it into Slack, etc.
Step 5: Make your first call
Now we'll use the key to send a request through the control plane. The key works with the OpenAI SDK, the Anthropic SDK, the Google GenAI SDK, or anything that speaks "OpenAI-compatible HTTP". Pick the one closest to what your applications will actually use.
Option A: curl (quickest)
curl https://your-vidai-server/v1/chat/completions \
  -H "Authorization: Bearer YOUR_VIDAI_KEY" \
  -H "Content-Type: application/json" \
  -d '{
    "model": "gpt-4o-mini",
    "messages": [{"role": "user", "content": "Say hello in one word."}]
  }'
Replace YOUR_VIDAI_KEY with the key you just copied, and
adjust the model name to one your deployment has registered.
A successful call returns an OpenAI-shaped JSON response.
Option B: OpenAI SDK (Python)
from openai import OpenAI

client = OpenAI(
    base_url="https://your-vidai-server/v1",
    api_key="YOUR_VIDAI_KEY",   # the VIDAI key, not your OpenAI key
)

response = client.chat.completions.create(
    model="gpt-4o-mini",
    messages=[{"role": "user", "content": "Say hello in one word."}],
)
print(response.choices[0].message.content)
Option C: Anthropic SDK (Python)
import anthropic

client = anthropic.Anthropic(
    base_url="https://your-vidai-server",
    api_key="YOUR_VIDAI_KEY",
)

response = client.messages.create(
    model="claude-haiku-4",
    max_tokens=64,
    messages=[{"role": "user", "content": "Say hello in one word."}],
)
print(response.content[0].text)
Client integrations has the full list of supported SDKs and the SDK × upstream support matrix.
📌 Worth knowing. The call routes through whatever rules your admins have set up: routing rules might redirect
gpt-4otogpt-4o-miniin dev environments, guardrails might mask sensitive content, rate limits might apply per key. None of this requires SDK changes; it's all configured server-side and applied transparently.
Verify it landed
Now go back to the console and open Observe → Request Logs. Your call should be at the top of the list, with your key's name in the API Key column, the model you called, the latency, and the status code.
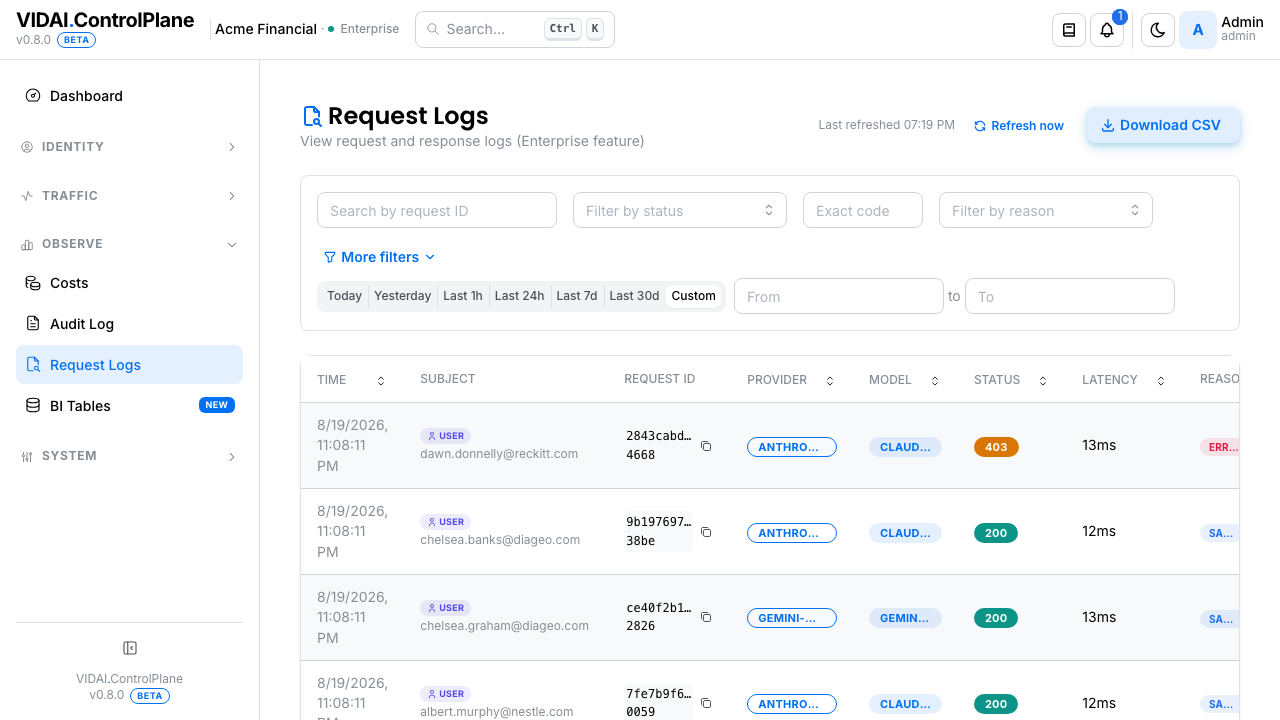
Click the row to see the full request and response, the upstream the control plane routed to, the cost it accrued, and any guardrail decisions. This view is your first stop when debugging anything later.
Step 6: Get oriented for what's next
You've done the loop: log in → see the dashboard → mint a key → make a call → see it in the logs. Everything else in the console builds on that loop.
The natural next steps depend on what you're trying to do:
- Add the upstream provider you actually want to call. If your deployment doesn't already have OpenAI / Anthropic / Gemini configured, Providers is where that lives.
- Add your team or your application. Keys minted in step 4 are yours alone. To give other people or applications access, you'll want to set them up first. Start with Users for people, or Applications and Agents for automated callers.
- Set up a routing rule. Automatic redirects, A/B
tests, deny policies, and spend circuits all live on the
Routing page. The most common first rule:
"redirect
gpt-4otogpt-4o-minifor the dev team to save money on test traffic." - Plan for upstream failure. Fallback lets you specify a backup chain so a flaky upstream doesn't take you down.
- Watch your costs. Costs shows you spend by user, model, group, key. Even on a fresh install, the first few days of real traffic make this page interesting fast.
💡 Pro tip. The Dashboard panels double as table-of-contents links. If a tile shows a number you want to drill into, click it; you'll land on the right page with the right filter applied.
Common questions
I clicked Create Key and the dialog closed without showing me the key. What now?
The key was created successfully (you'll see a row for it on the list), but you didn't catch it in the reveal-once moment. Delete that row and create a fresh key; there's no recovery path for an un-copied key.
My request returned
401 Unauthorizedeven though I copied the key correctly. Why?Three usual suspects: (1) you sent the upstream provider's key instead of the VIDAI key (the control plane only knows VIDAI keys); (2) your key was disabled (check the API Keys list, look for "Disabled" badge); (3) you used
Bearercapitalisation differently, so the header must beAuthorization: Bearer <key>exactly.My request returned
403with a guardrail message. What triggered it?A guardrail rule matched the content of your request. Request Logs shows which rule fired and which content was flagged. If it's a false positive, the rule's action might need tuning. See Guardrails.
My request returned
404for the model name. Is the model wrong?Either the model isn't registered on the control plane, or your key isn't allowed to call it. Models shows the registry; API Keys shows your key's allowed-models list.
The dashboard panels are all zero / "all clean". Did something break?
No. Your deployment just hasn't seen traffic yet. Make a few calls (step 5 above) and the panels start populating within a minute. The 7-day window is the default; switch to a longer window if you've been running for a while but the dashboard still looks empty.
Can I do everything in this guide via the API instead of the console?
Yes. Every console action is backed by a corresponding admin API call. The console is the friendly path; the API is the scripted path. The two are always in agreement: anything you do via the API shows up in the console immediately.
I'm stuck on something not covered here. Where do I get help?
Reach out to your VIDAI support contact. The Console navigation page has a "where common actions live" lookup table that handles most of the second-30-minutes questions; if it's not there, support is the next stop.
Where to go next
- Console navigation: sidebar grouping, the bell, role gating, and a "where common actions live" lookup table.
- Client integrations: the full list of supported SDKs, SDK × upstream matrix, and framework integrations.
- API Keys: the deeper guide to key lifecycle, allowed models, guardrail overrides, and the deep-link relationship with Users.
- Dashboard: what every panel actually shows, and how to read the headline numbers.